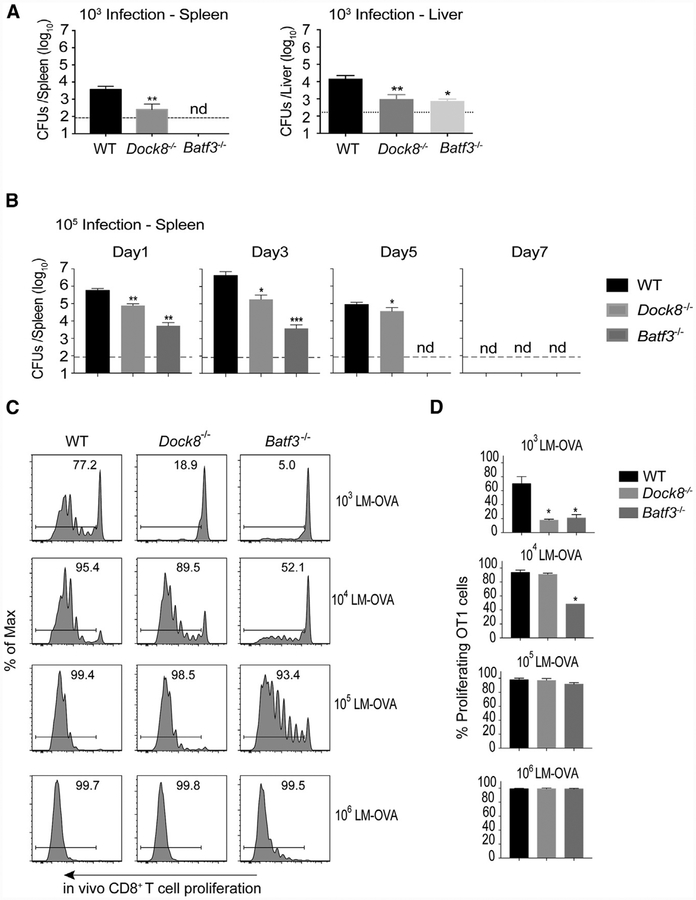
Figure 2. Dock8−/− Mice Are Resistant to Live Listeria Infection.
(A) WT, Dock8−/−, and Batf3−/− mice were i.v. infected with 103 live rLm-OVA. The burdens of rLm-OVA in the spleen and liver were determined by colony-forming units (CFUs) on day 3 after infection. Dashed lines indicate detection limit. Results are representative of two independent experiments with n = 4 or 5/group.
(B) WT, Dock8−/−, and Batf3−/− mice were i.v. infected with 10s live rLm-OVA. The burden of rLm-OVA in the spleen was determined by CFUs at the indicated time points after infection. Results are representative of two independent experiments with n = 4 or 5/group.
(C and D) 1 × 10⁶CFSE-Iabeled OT-1 T cells were adoptively transferred into WT, Dock8−/−, and Batf3−/− mice. 1 day later, recipient mice were i.v. infected with the indicated dose of live rLm-OVA. 3 days later, T cell proliferation was analyzed by flow cytometry. Representative flow cytometry plots (C) and summary bar graphs (D) are shown. Results are representative of three independent experiments with n = 2 or 3/group.
Data are means ± SD. *p < 0.05, **p < 0.01, ***p < 0.001 (compared with the WT); nd, not detectable. See also Figure S2.

