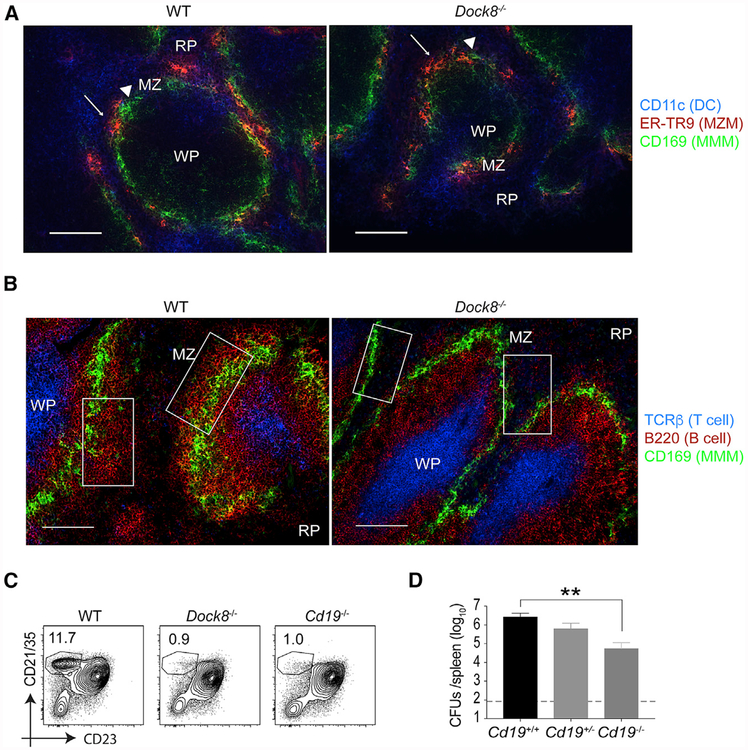
Figure 4. Loss of MZ B Cells Enhances Resistance to Listeria Infection.
(A and B) Fluorescence images of a spleen from a naive WT mouse (left) and a Dock8−/− mouse (right).
(A) Dendritic cells (DCs; CD11c in blue), marginal zone macrophages (MZMs; ER-TR9 in red, white arrow), and metallophilic macrophages (MMMs; CD169 [MOMA-1] in green, white triangles). Scale bars, 100 μm.
(B) T cell zone (T cell receptor β [TCRβ] in blue), B cells (B220 in red), and MM Ms (CD169 in green). Scale bars, 100 urn. White squares in the panels indicate MZ B cell areas. A representative spleen from 4 different mice/group is shown.
(C) Naive WT, Dock8−/− and Cd19−/− mice were analyzed for the percentages of the MZ B cell population among total B cells in the spleens by flow cytometry.
(D) WT (Cd19+/+), Cd19+/−, and Cdt9−/− mice were i.v. infected with 105 live rLm-OVA. The burdens of rLm-OVA in the spleen were determined by CFUs on day 3 after infection. **p < 0.01. Results are representative of two or three independent experiments with n = 4 or 5/group. RP, red pulp; WP, white pulp; MZ, marginal zone. Data are means ± SD. See also Figure S4.

