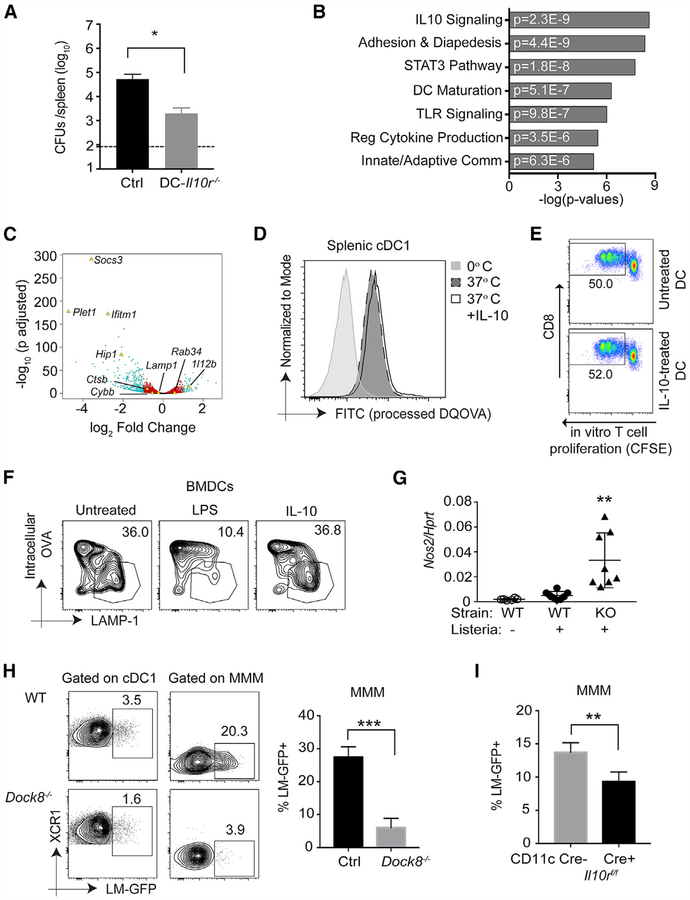
Figure 7. IL-10 Enhances the Intracellular Bacterial Load Directly in Marginal Zone Metallophilic Macrophages but Not cDC1s.
(A) DC-II10−/− (Cd11ccre-II10rfl/fl) and (II10rfl/fl) Cre− control female mice were i.v. infected with 105 live rLm-OVA. The burdens of rLm-OVA in the spleen were determined by CFUs on day 3 after infection. Results are representative of two independent experiments with n = 4 or 5/group.
(B and C) RNA-seq analyses of live CD11c+ MHChlCD11b−CD8+ splenic cDC1s stimulated with medium or 200 ng/mL IL-10 for 4 h.
(B) Ingenuity Pathway Analysis (IPA) showing selected significant canonical pathways.
(C) Volcano plot showing statistical significance against fold change between control-and IL-10-treated samples. Teal dots, adjusted p value (p adj.) ≤ 0.05 and fold change of ≥ 2; red dots, p adj. < 0.05 and fold change of < 2; black dots, p adj. > 0.05 and fold change of < 2. Genes of interest (some significant and some not) are indicated with labels and yellow triangles.
(D) Primary splenic DCs were incubated with 200 ng/mL IL-10 for 16 h and then incubated with 100 μg/mL DQ OVA for 20 min at 0°C or 37°C. After thorough washing, DC populations and processed DQ OVA (fluorescein isothiocyanate [FITC]) were identified and quantified by flow cytometry. Data shown are representative of two independent experiments.
(E) Enriched splenic WT DCs were incubated in the presence or absence of 200 ng/mL recombinant murine IL-10 (rmlL-10) for 4 h at 37°C. The pretreated DCs were further pulsed with 100 jxg/mL OVA for 1 h at 37°C, and free OVA was removed by washing. Pulsed DCs were then co-cultured with CFSE-labeled purified OT-1 T cells for 72 h. OT-1 proliferation was assessed by measuring CFSE dilution by flow cytometry. Numbers indicate the percentage of proliferating cells in the indicated gates. Shown is one representative of two independent experiments.
(F) WT BMDCs were incubated in the presence of 100 ng/mL lipopolysaccharide (LPS) (16 h) or 200–500 ng/mL IL-10 (4–16 h) before bead-bound OVA was phagocytosed. Phagosome maturation was analyzed by flow organellocytometry to assess phagosomal OVA degradation in addition to phagosomal acquisition of LAMP-1 after a 120-min chase period. The data displayed here are representative of three independent experiments.
(G) WT and Dock8−/− female mice were or were not infected with 5–10 × 108 Lm-GFP. 4 h later, Nox2 mRNA analysis was performed by qPCR on total splenocytes. Results are pooled from two independent experiments. **p < 0.01 compared with the WT with or without Listeria infection.
(H) WT and Dock8−/− female mice were i.v. infected with 5–10 × 108 Lm-GFP. 4 h later, the mice were sacrificed to measure intracellular Listeria in XCR1+ cDC1 s and CD169+ MMMs. ***p < 0.001. Results are representative of two independent experiments with n = 3–5/group.
(I) WT mice receiving BM from DC-II10r−/− (Cd11ccre-H10rfl/fl) or Cre− control female mice were i.v. infected with 5–10 × 108 Lm-GFP. 4 h later, intracellular Listeria in CD169+ MMMs was measured by flow cytometry. **p < 0.01. Results are representative of two independent experiments with n = 4/group. Data are means ± SD. See also Figure S7.

