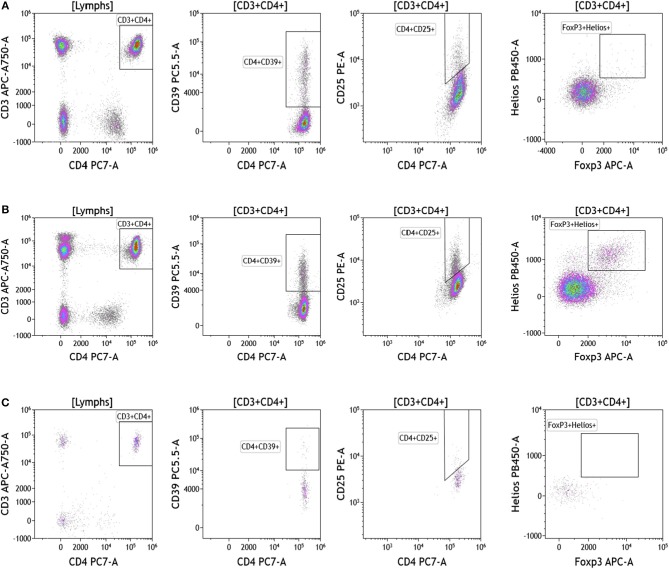
Figure 4.
Regulatory T cell analysis in peripheral blood of patients with cancer. Non-single events were excluded as described in Figure 1. (A) melanoma; (B) breast cancer; (C) brain cancer. CD4 T cell populations were identified based on expression of CD45, CD3, and CD4 expression. CD25, Foxp3, Helios1, and CD39 expression was assessed against CD4 expression. Range in frequency of cell subsets is shown in Table S4.

