FIGURE 5.
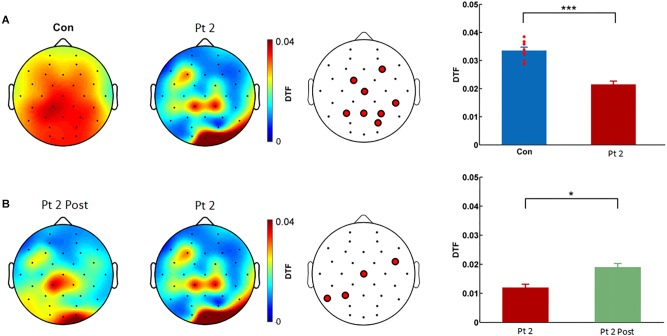
Comparison of DTF in the gamma frequency of EEG between controls and patient 2 before and after routine treatment. (A) DTF spatial distribution in healthy controls (Con) and patient 2. First panel: eight healthy controls. Second panel: compared to the eight healthy controls, patient 2 showed a significantly decreased DTF value in the gamma frequency in bilateral posterior regions. Third panel: eight electrodes (F4, FC1, Cz, P3, Pz, P4, PO4, and CP6) with significantly reduced DTF values in patient 2 compared to those in Con were identified. Fourth panel: the average DTF value of the eight electrodes was significantly lower in the patient 2 than in the Con (∗∗∗p < 0.001, t-test/Wilcoxon’s rank sum test). The blue bar denotes the DTF value of eight electrodes in eight controls. The red bar denotes the pretreatment DTF value of eight electrodes in the patient. The DTF value (averaged across channels) of each single healthy control is shown as a dot. (B) Spatial distribution of the DTF in patient 2 before and after routine treatment. First panel: after routine treatment, patient 2 showed a significant increase in the DTF value in the gamma frequency in bilateral posterior regions. Second panel: patient 2 before treatment. Third panel: four electrodes (FC6, Cz, P3, and T5) with significantly higher DTF values (p = 0.021) after treatment compared to those before treatment were identified (∗p < 0.1). The red bar denotes the pretreatment DTF value of the four electrodes in the patient. The green bar denotes the post-treatment DTF value of four electrodes in the patient. DTF, directional transfer function; EEG, electroencephalography; Con, controls; Pt 2 Post, patient 2 after treatment.

