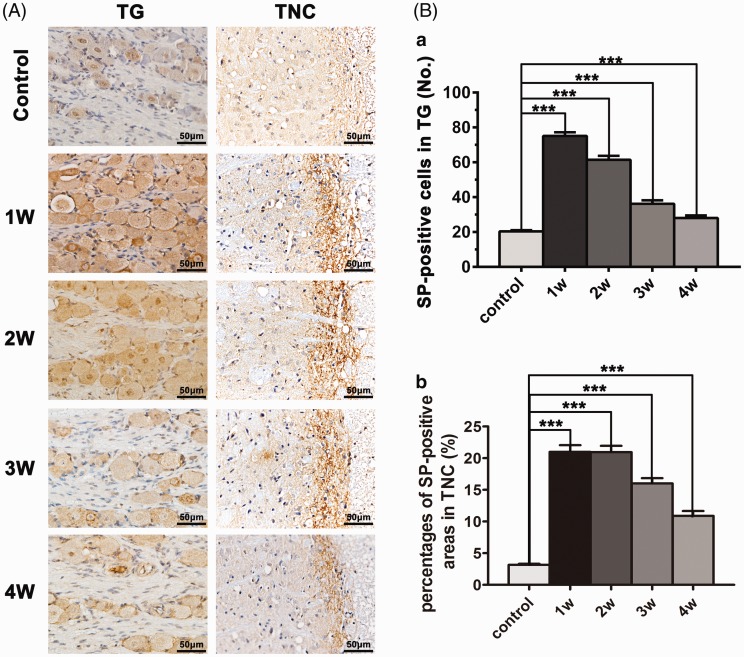
Figure 4.
SP expression in the TG and TNC. (A) Compared with the control group, SP expression in the TG and TNC was upregulated in the experimental group. (B) In the experimental group, SP expression in the TG and TNC increased and peaked at one week and then gradually decreased at three and four weeks (*p < 0.05, **p < 0.01, ***p < 0.001). TG: trigeminal ganglion; TNC: trigeminal nucleus caudalis.

