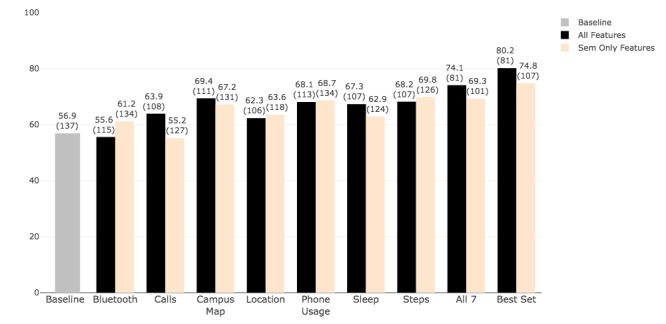
Figure 6.

Detection of postloneliness level (high loneliness or low loneliness) using all-epochs features and semester-level features. Each bar shows the accuracy followed by the number of samples used in the analysis in parentheses; the gray bar represents the baseline accuracy as measured by the percentage of samples belonging to the majority class here, that is, high loneliness. Sem: semester.
