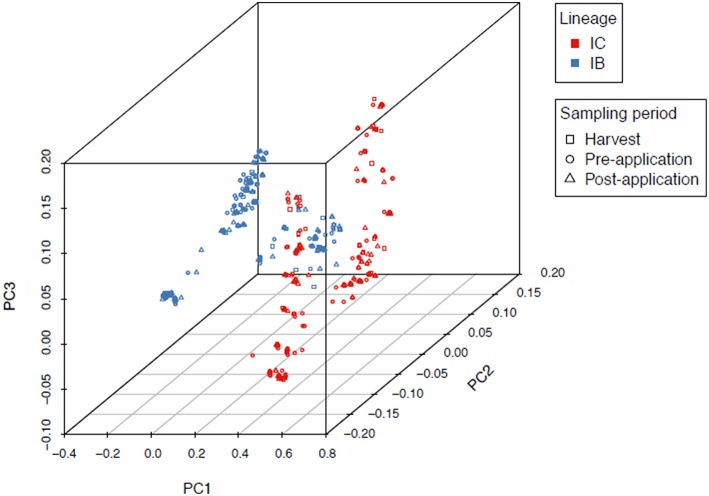
Figure 2.
Principal component analysis of 1,282 A. flavus isolates showing two distinct clusters identified as lineages IB and IC based on MLST loci (trpC, AF17, and mfs). Admixture between IB and IC is indicated as a mix of red and blue lineage colors in the middle of the first principal component axis (PC1). There was a significant (P < 0.00001) association between lineage and sampling period.

