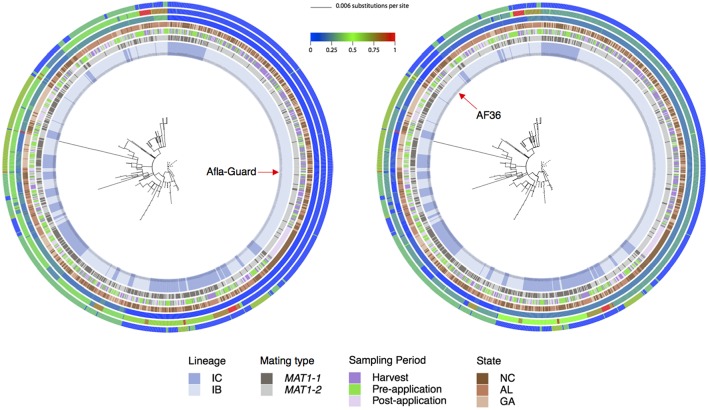
Figure 3.
Phylogenetic relationships showing patristic distances of 1,282 A. flavus isolates to the Afla-Guard strain (radial tree on left) or the AF36 strain (radial tree on right). In the center of each radial ring is the best maximum likelihood tree for the combined MLST loci (trpC, AF17, and mfs) with branches drawn to scale (scale bar is shown at the top). The four innermost rings represent A. flavus lineage as inferred from principal component analysis, mating type, sampling period, and state, respectively. The three outermost rings represent patristic distances for AF17, mfs, and trpC, respectively. The distance of each isolate from Afla-Guard or AF36 as a reference is shown using a heat map, where a value of 0 (blue) indicates high genetic similarity of the strain to the reference and a value of 1 (red) is high genetic dissimilarity.

