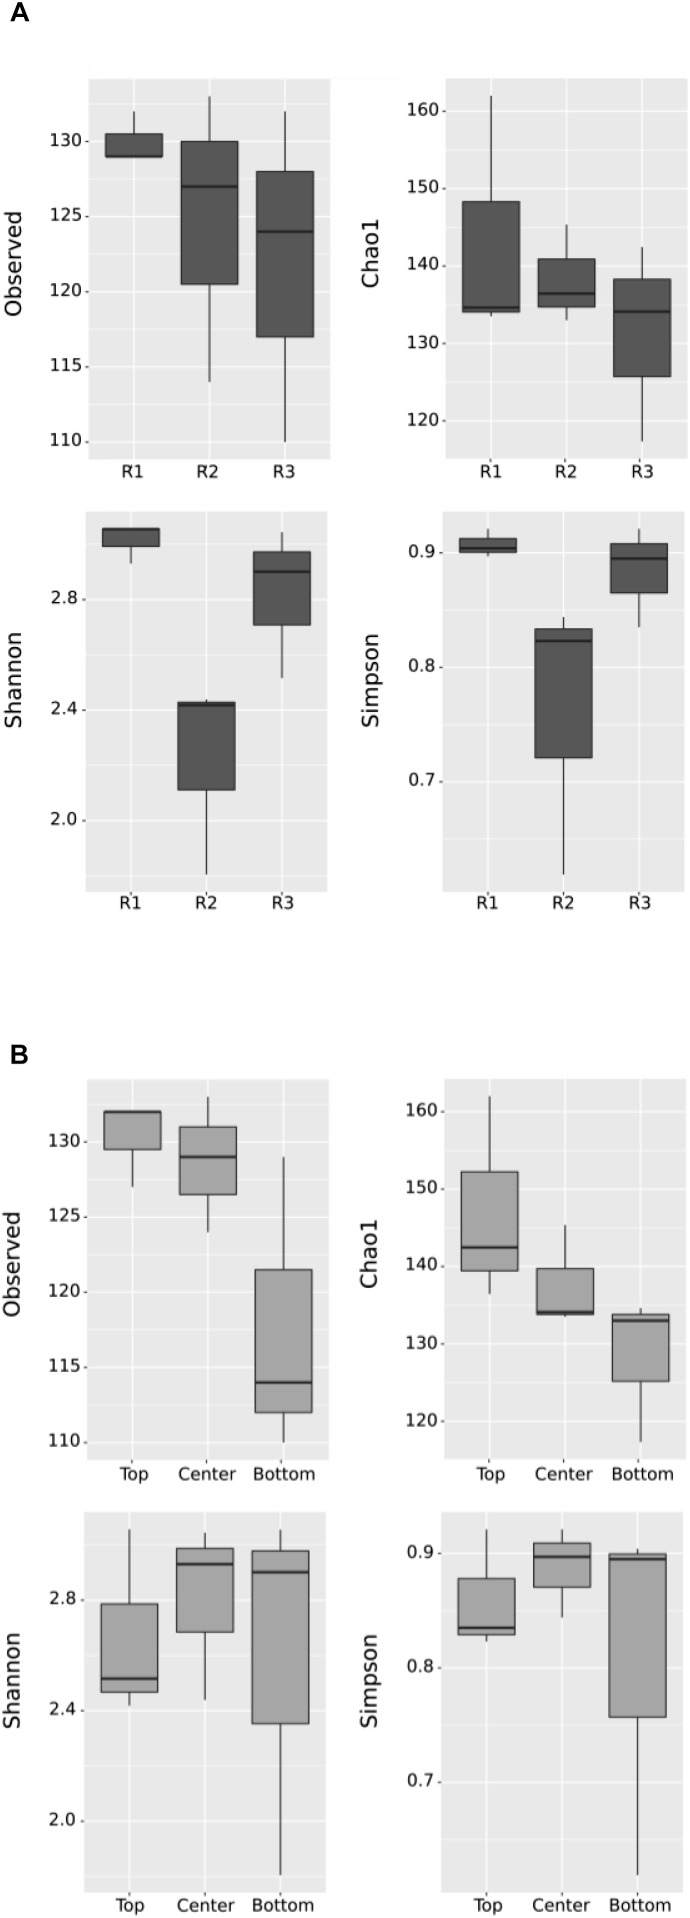
FIGURE 4.
Box plot of alpha diversity using observed OTUs, Chao1, Shannon–Weaver and Simpson diversity indices by (A) Reactor and (B) Position. “R1,” “R2,” and “R3” refer to Reactor 1, Reactor 2, and Reactor 3. Each box represents the middle 50% of the data, while the middle quartile marks the mid-point. The lower quartile presents the 25% of scores that fall below the inter-quartile, while the upper quartile represents the 25% above the inter-quartile. No significant difference, except in the Shannon plot by Reactor, in (A) (ANOVA, F = 7.34, p = 0.0244).

