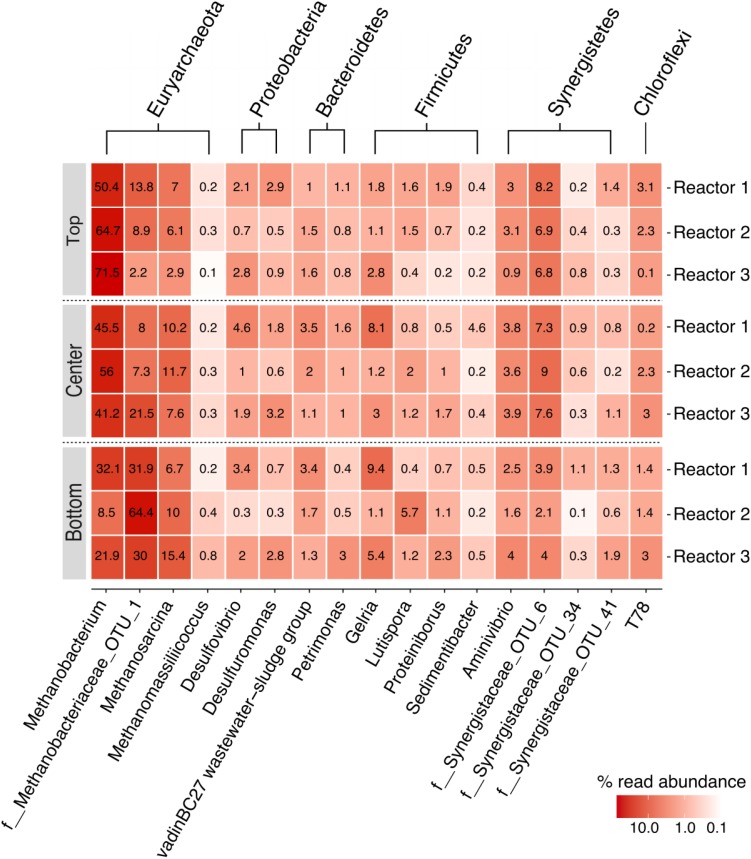
FIGURE 5.
Heatmap of the relative read abundance (%) of the core community members for each of the three replicate reactors, rarefied to 41,944 reads. Taxonomic classification is indicated along the two x-axes; phylum-level classifications are shown along the secondary x-axis and genus level or lowest taxonomic classification (f: family) possible are shown along the primary x-axis.

