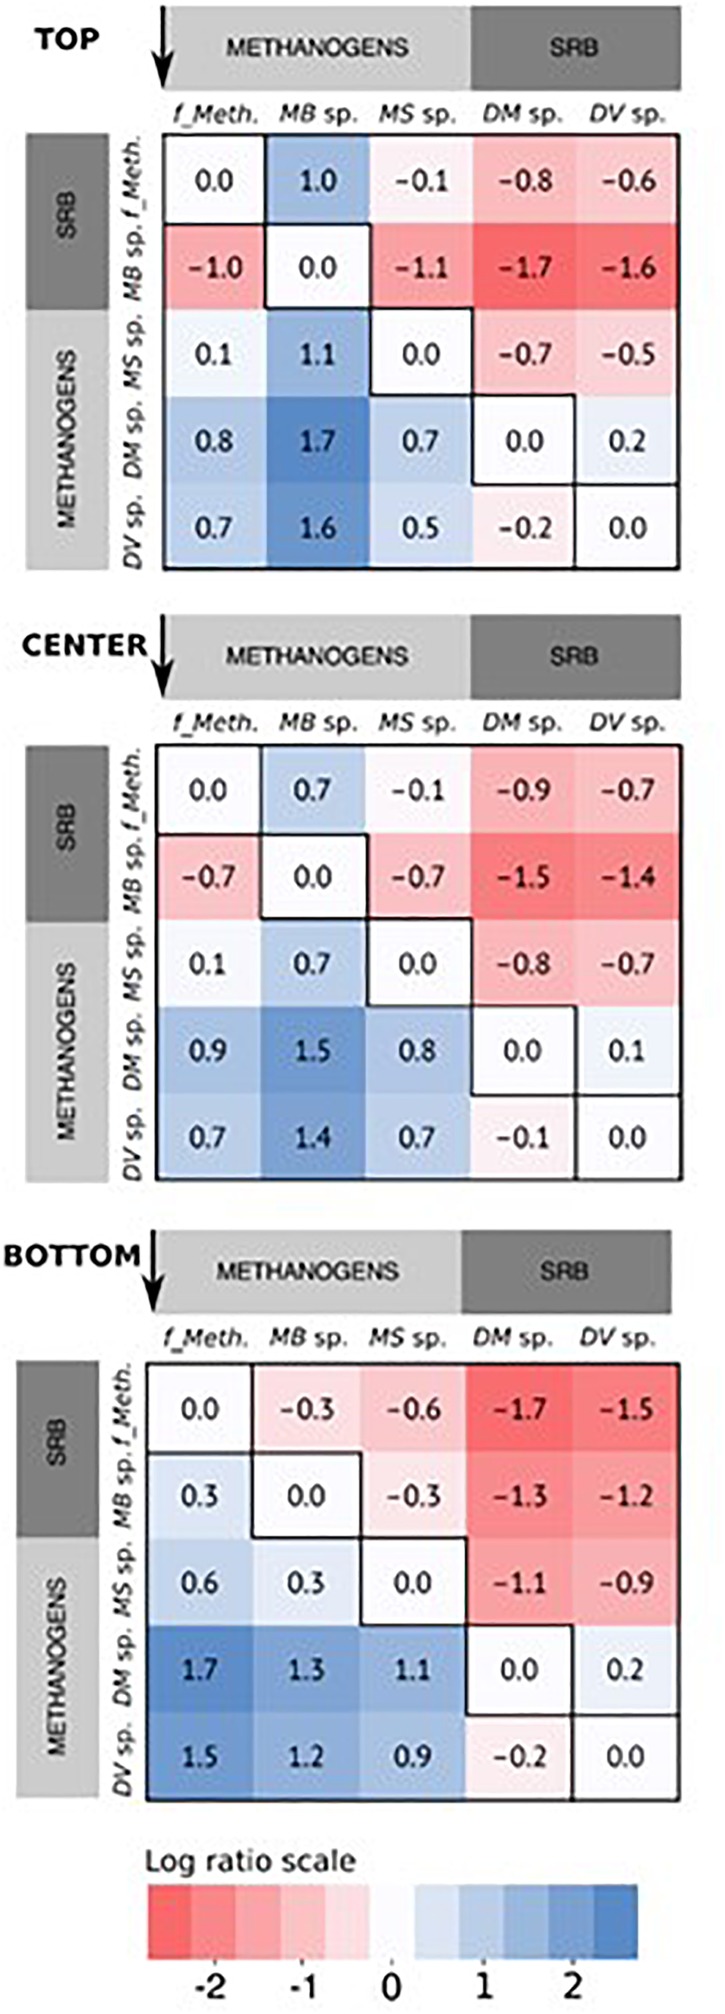
FIGURE 6.
Heatmap of the log abundance ratio of the core community of methanogens and sulfate-reducing bacteria (SRB) arranged by sampling position, based on the average of the relative read abundance for the three replicates reactors. The ratios are presented as the ratio of the specific microbial community along the x-axis to that along the y-axis, in the direction indicated by the arrows for each figure. For the methanogens, “f_Meth.” is the family Methanobacteriaceaea, “MB sp.” is Methanobacterium sp., and “MS sp.” is Methanosarcina sp. For the SRBs, “DM sp.” is Desulfuromonas sp., and “DV sp.” is Desulfovibrio sp.

