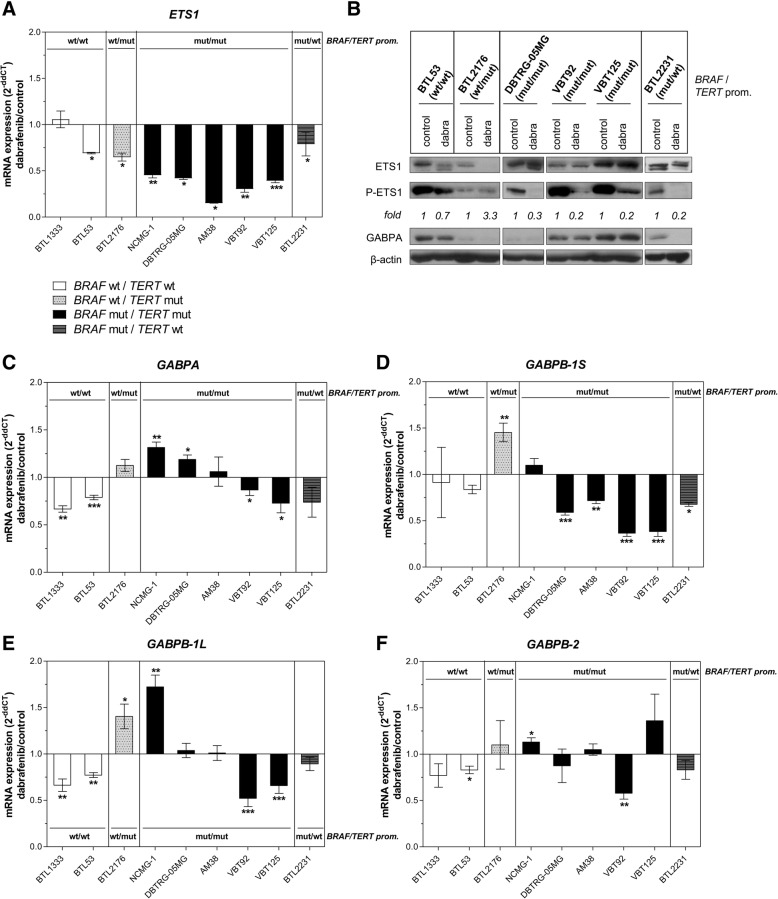
Fig. 4.
Regulation of ETS-factors by oncogenic BRAF signaling. a mRNA and (b) protein expression/phosphorylation levels of ETS1/GABPA upon 16 h at 1 μM (qRT-PCR) and 6 h at 1 μM (Western blot) dabrafenib treatment. Fold values are given as normalized expression to β-actin and subsequent calculation of the ratio phospho/total ETS1 and are normalized to the respective untreated controls. mRNA expression levels of (c) GABPA, (d) GABPB-1S, (e) GABPB-1 L, and (f) GABPB-2 are depicted for the indicated cell models upon dabrafenib treatment (1 μM, 16 h). *p < 0.05, **p < 0.01, ***p < 0.001 (unpaired students’ t-tests); All values are given as mean +/− SD; wt = wild-type, mut = mutated, dabra = dabrafenib

