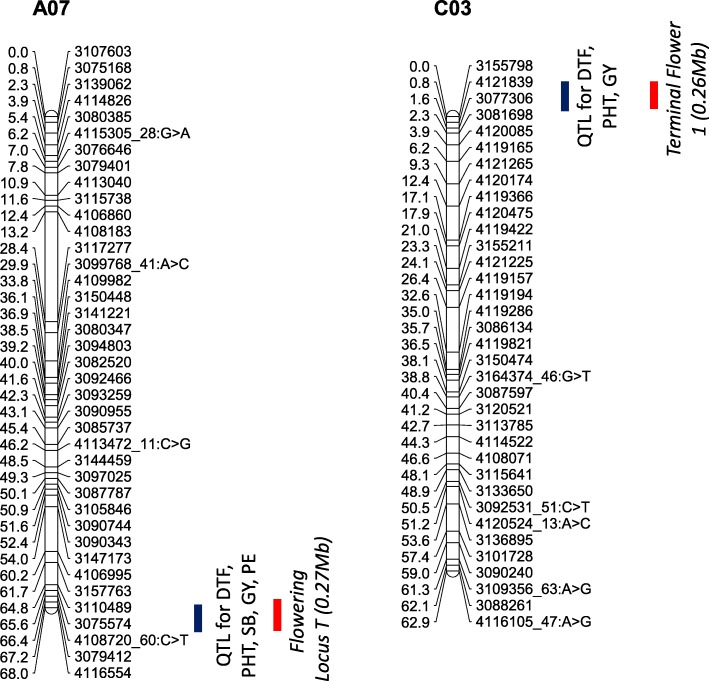
Fig. 7.
Graphical representation showing localisation of multi-trait QTL for plant emergence (PE); above ground shoot biomass (SB); flowering time (days to flower, DTF); plant height (PHT) and grain yield (GY) in a doubled haploid population from Skipton/Ag-Spectrum//Skipton. DArTseq markers and their genetic map positions are shown on right- and left-hand side, respectively. Solid lines (in blue and red colour) represent to markers that showed significant associations with traits of interest. Map distances are given in cM and displayed using the MapChart

