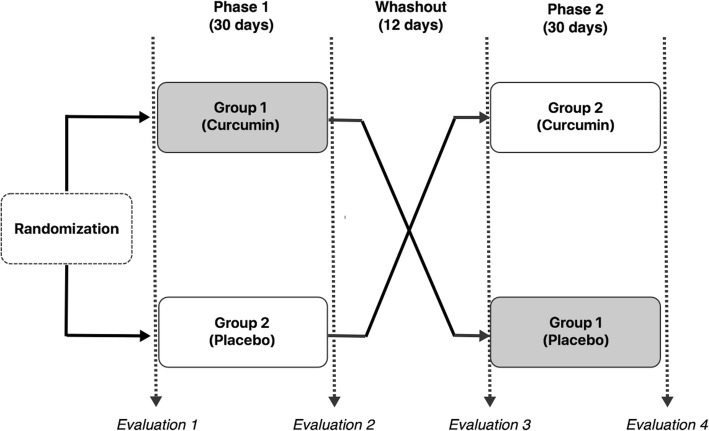
Fig. 1.
Study Design. Legend: This figure shows the formulation of the trial, including the randomization process, phase 1, washout, and phase 2 periods. Also, it shows the groups 1 and 2 as experimental group (EG) and control group (CG), respectively, and their cross-over during the follow up. In addition, four reference points for evaluations 1–4 are pointed out. Each evaluation was comprised by full assessment, including anamnesis, 24-h dietary recall, indirect calorimetry, dual-energy X-ray absorptiometry, blood collection, and biochemical analysis

