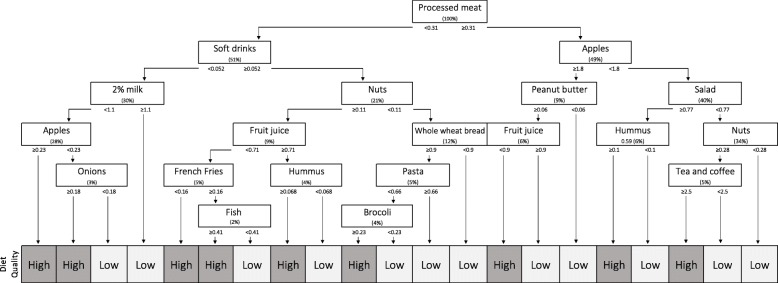
Fig. 2.
Classification and regression tree for the prediction of diet quality (N = 1040). Each box represents a split of the sample according to a specific food item predicting the diet quality outcome. The percentage of the total sample used at each split is shown in parentheses. Cut-offs of binary division are selected by the model to create the two most distinctive subgroups based on the diet quality outcome to predict (low vs. high). Cut-offs in servings/day are presented for each split under the box. Each sequence of questions yields the predicted diet quality (low or high)

