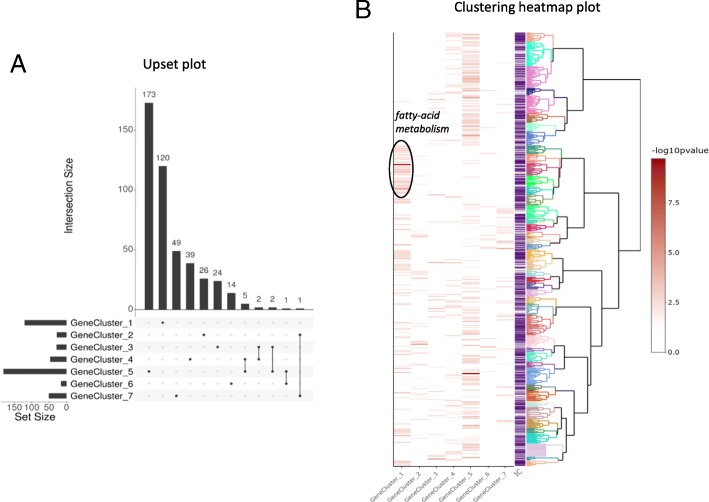
Fig. 4.
Visualization of ViSEAGO’s functional analysis from chicken RNA-seq with seven different transcriptomic datasets. a Upset plot representing overlaps between lists of enriched GO terms, b Clustering heatmap plot combining a dendrogram based on Wang’s semantic similarity distance and ward.D2 aggregation criterion, a heatmap of -log10(p-value) from functional enrichment test(s) of the seven lists of genes and information content (IC)

