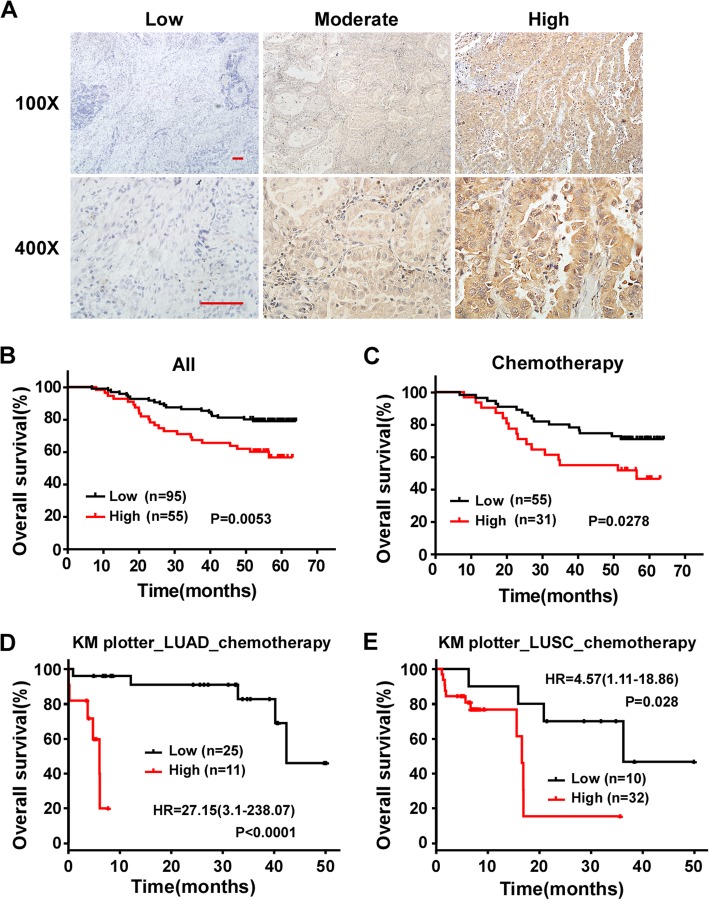
Fig. 2.
High PTOV1 expression correlates with poor prognosis and chemo resistance in NSCLC patients. a Representative pictures of NSCLC tissues with low, modulate and high PTOV1 expression levels analyzed by IHC staining. Scale bars, 50 μm. b and c Kaplan-Meier analysis of overall survival in all NSCLC patients (b) and the subgroup patients received chemotherapy (c). d and e Kaplan-Meier analysis of overall survival in the LUAD (d) and LUSC (e) subgroup patients received chemotherapy by the Kaplan–Meier Plotter online database. P values are calculated by log-rank test

