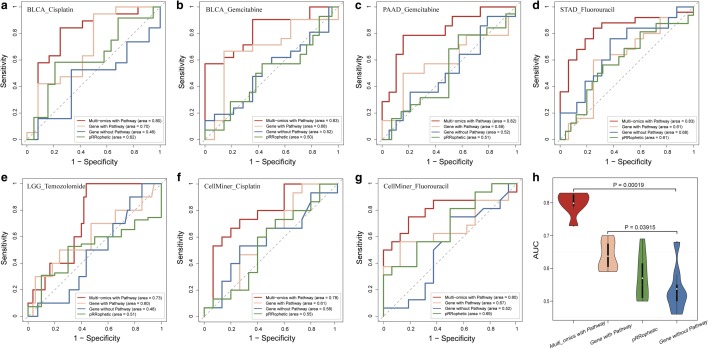
Fig. 4.
Performance comparisons of drug response prediction models based on the identified multi-omics subpathway signatures (multi-omics with pathway), single omics subpathway signatures (gene with pathway) and gene signatures (gene without pathway and pRRophetic), respectively. ROC curves in the a BLCA_cisplatin, b BLCA_gemcitabine, c PAAD_gemcitabine, d STAD_fluorouracil, e LGG_temozolomide, f CellMiner_cisplatin and g CellMiner_fluorouracil. h Violin plots indicate the AUCs distribution and average values (white dot) of each model in seven datasets. P-values are the maximum P-values of the AUCs of Multi-omics with Pathway versus the AUCs of remaining three, and the AUCs of Gene with Pathway versus the AUCs of remaining two by the paired t-test

