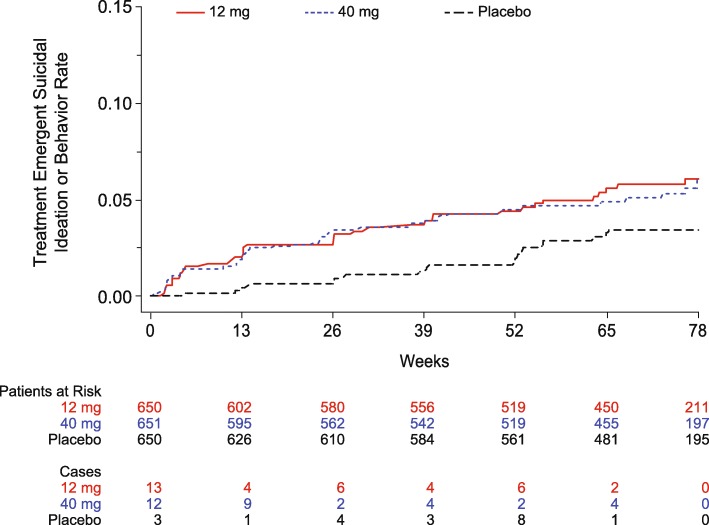
Fig. 2.
Kaplan-Meier plot of time to first treatment-emergent suicidal ideation/behavior. This analysis uses the time frame between the screening and baseline clinic visits as the reference period for determining “treatment-emergent.” “Patients at Risk” shows the number of evaluable patients at each time point by treatment group. “Cases” shows the number of new cases of suicidal ideation/behavior occurring between the corresponding time point and the next time point (e.g., for 12 mg, there were 13 new cases of suicidal ideation/behavior between week 0 and week 13). A difference in the risk of suicidal ideation/behavior between verubecestat and placebo occurred within the first 6 months of treatment but did not progress further through the remainder of the trial

