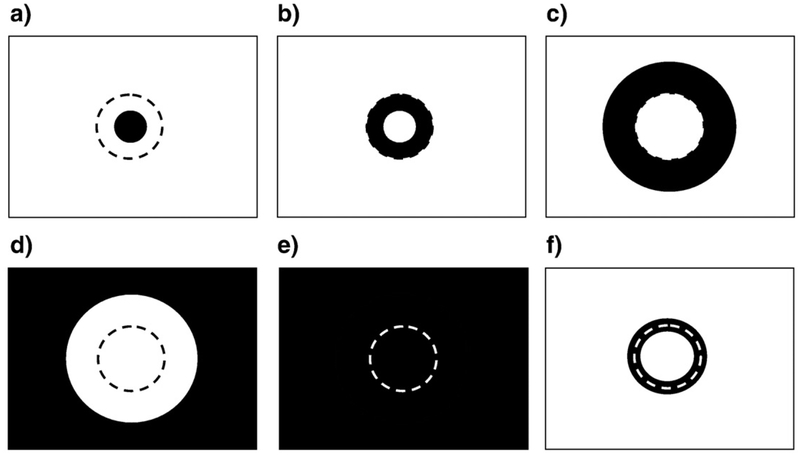
Fig. 4 –
The V1 analysis zones were designed as probes of the separate subregions of stimuli a–d (Fig. 3), together with a narrow zone around the edge (dashed line) that was in common between them and the whole stimulus field. These regions were the V1 projections labeled as (a) Center1, (b) Center2, (c) Periph1, (d) Periph2, (e) Whole Field, (f) Edge. Each area was projected to its retinotopic representation in V1 to form the corresponding ROI. The dashed circle indicates the edge region common among stimuli b and c (Fig. 3).

