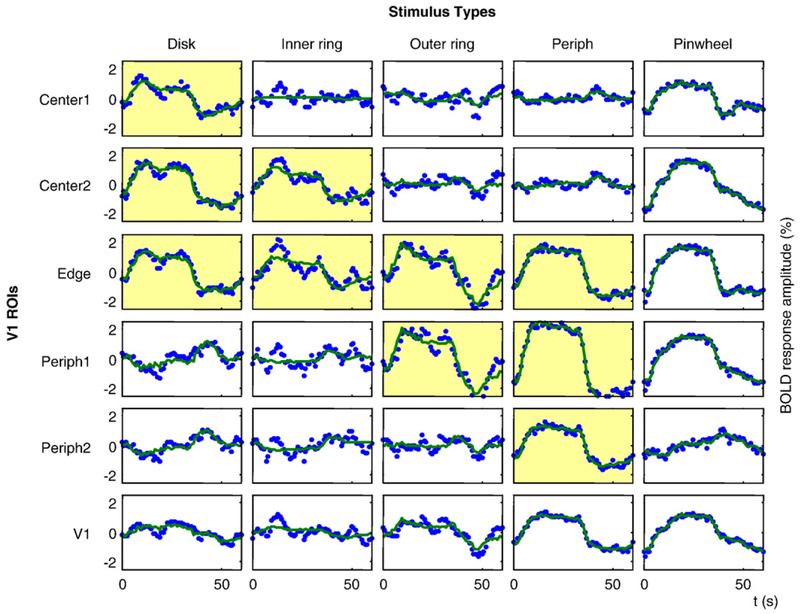
Fig. 5 –
Example of voxel-averaged data for five stimuli and six ROIs (blue dotted curves). Observer LLK, right hemisphere. The data were fit by linear combinations of the time courses for the first three ICs as shown by green curves. Yellow coloration indicates cases where the activation region was within the analysis region for the stimulus location.

