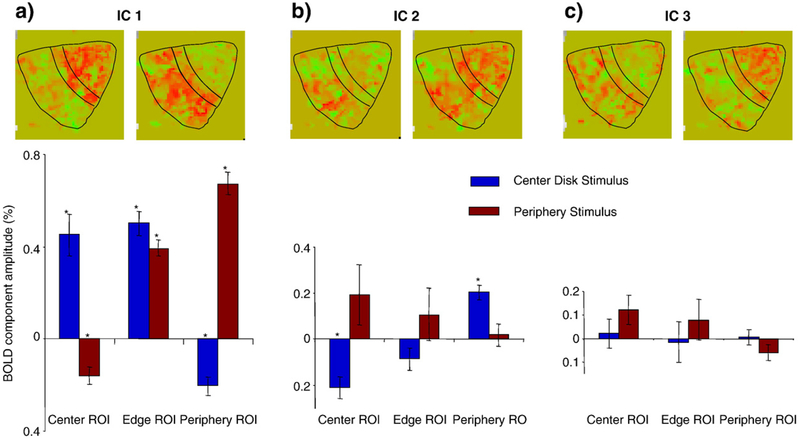
Fig. 7 –
The bar graphs depict the average component magnitudes of first three ICs normalized to the total activity in V1 (three panels) for three ROIs (Center, Edge, and Periphery—on the abscissa) and two stimuli (Center Disk and Periphery—blue and brown bars). The data are averaged across six V1 areas. The error bars represent the standard errors and the asterisks indicate statistically significant activations at p<0.001 (≈p<0.05, corrected for multiple applications). Each pair of magnitude maps above the bar graphs (right hemisphere, subject ARW) illustrate the spatial distributions for each of the 3 ICs for the Center Disk (left) and Periphery (right) stimuli. The black contours show Center, Edge and Periphery ROIs in V1; the foveal representation is at top–right.

