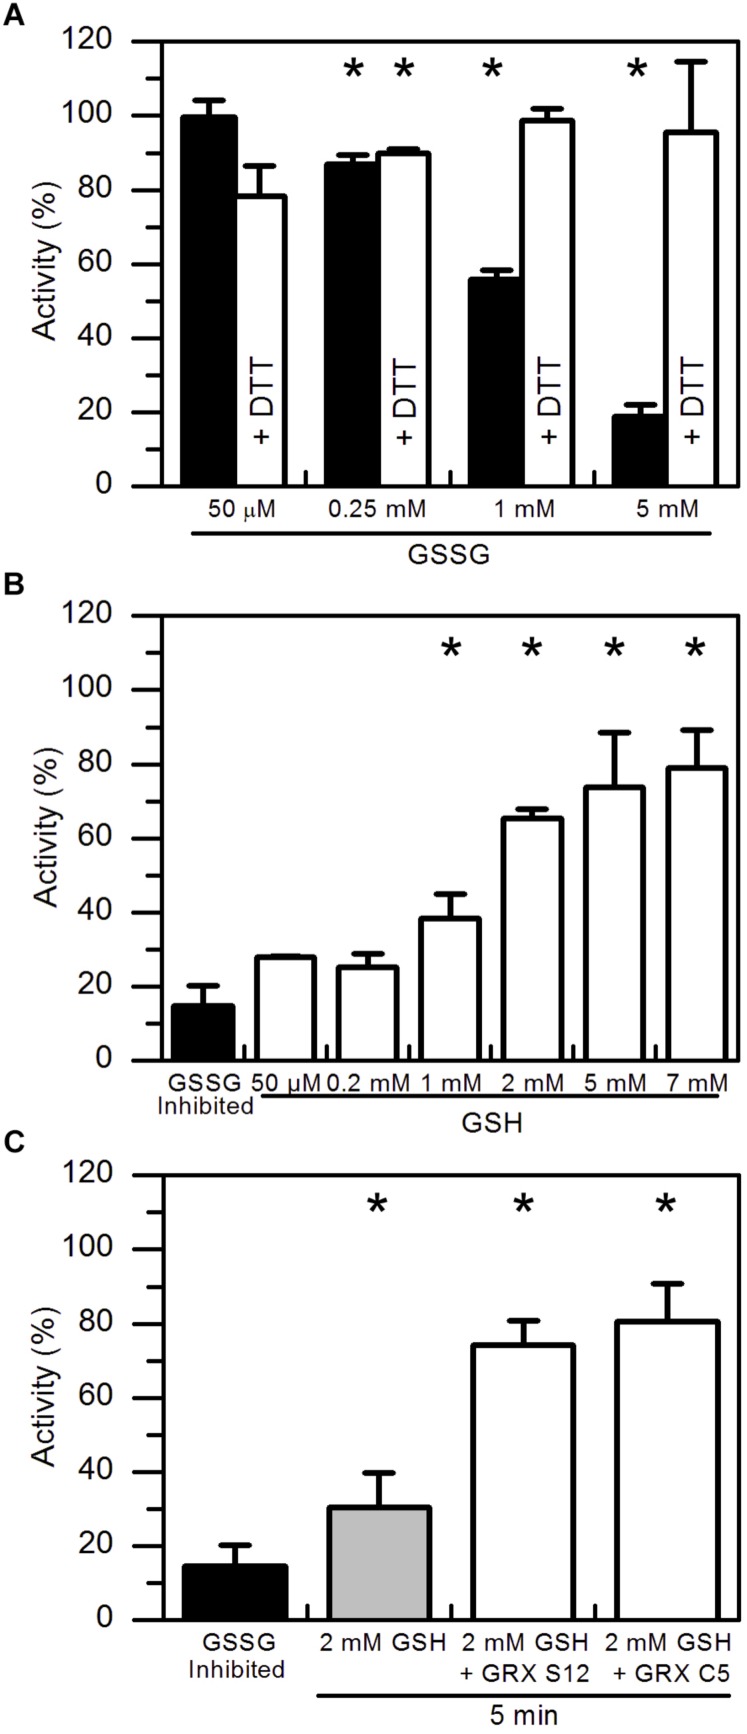
FIGURE 2.
Reactivation of GSSG-inhibited AtAMY3 by GSH and effect of GRXs on the reactivation rate. (A) Inactivation of AtAMY3 after 1 h incubation with 50 μM, 0.25 mM, 1 mM, and 5 mM GSSG (black bars). The reversibility of the inhibition was tested by incubating samples for additional 30 min in presence of 80 mM DTT (white bars). Activities are expressed as percentages of reduced sample obtained by incubating glutathionylated AtAMY3 in presence of 80 mM DTT for 30 min at 25°C. Data are reported as mean ± SD (n = 3). Significant reduction in enzyme activity compared to the pre-reduced enzyme was determined based on P-values obtained from Student’s t test. *P < 0.01. (B) Recovery of catalytic activity of AtAMY3 pre-treated with GSSG (black bar) by increasing concentrations of GSH. GSSG-inhibited samples (black bar) were incubated for 30 min at 25°C at different concentrations of GSH (white bars). Activities are expressed as percentages of fully active AtAMY3, obtained by incubating GSSG-inhibited enzyme for 30 min in presence of 80 mM DTT. Data are reported as mean ± SD (n = 3). Significant increase in enzyme activity compared to the GSSG-treated enzyme was determined based on P-values obtained from Student’s t test. *P < 0.01. (C) GSSG-inhibited AtAMY3 (black bar) was incubated with 2 mM GSH in absence (gray bar) or presence (white bars) of GRX S12 or C5. Activities are expressed as percentages of fully active AtAMY3, obtained by incubating GSSG-inhibited enzyme with 80 mM DTT for 30 min. Data are reported as mean ± SD (n = 3). Significant increase in enzyme activity compared to the GSSG-treated enzyme was determined based on P-values obtained from Student’s t test. *P < 0.01.

