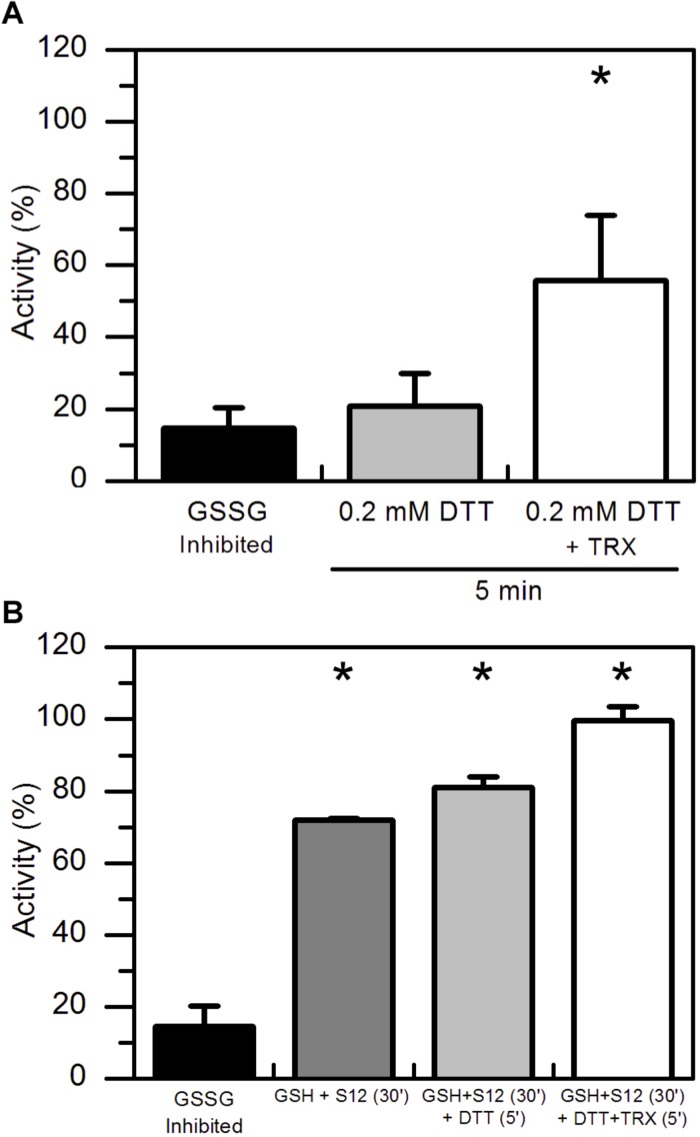
FIGURE 3.
TRX-dependent reactivation of GSSG-inhibited AtAMY3 and effect of both GRX S12 and TRX. (A) GSSG-treated AtAMY3 (black bar) was incubated in presence of 0.2 mM DTT without (gray bar) or with (white bar) 10 μM TRX. Activities are expressed as percentage of fully reduced samples obtained after 30 min incubation of GSSG-inhibited AtAMY3 with 80 mM DTT. Data are reported as mean ± SD (n = 3). Significant increase in enzyme activity compared to the GSSG-inhibited enzyme was determined based on P-values obtained from Student’s t test. *P < 0.01. (B) GSSG-inhibited AtAMY3 (black bar) was incubated for 30 min with 2 mM GSH and 5 μM GRX S12 (gray bar). After 30 min incubation, 0.2 mM DTT was added to the mixture either in the absence (pale gray bar) or in the presence (white bar) of commercially available TRX. Incubation was extended for another 5 min at 25°C before measuring AtAMY3 activity. Activities are expressed as percentage of fully reduced samples obtained after 30 min incubation of GSSG-inhibited AtMY3 with 80 mM DTT. Data are reported as mean ± SD (n = 2). Significant increase in enzyme activity compared to the GSSG-inhibited enzyme was determined based on P-values obtained from Student’s t test. *P < 0.01.

