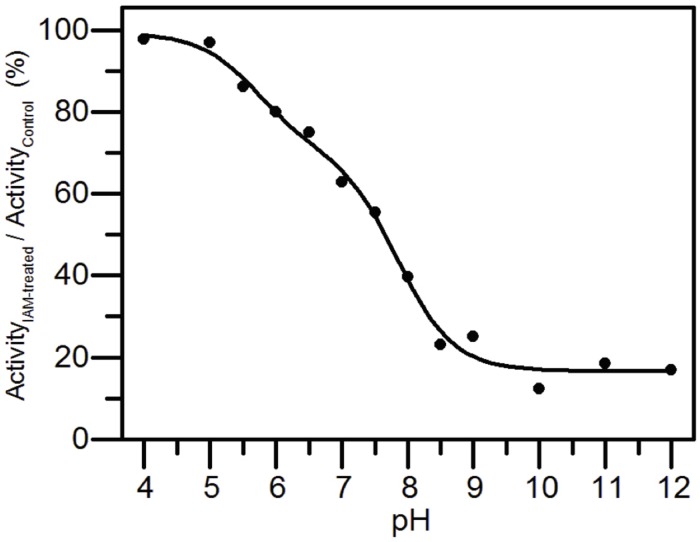
FIGURE 5.
pKa determination of the catalytic cysteines of AtAMY3. AtAMY3 was incubated in different buffers ranging from pH 4 to 12 in presence or absence of IAM before measuring the activity. The residual activity at each pH value was calculated as percentage of inhibition between IAM-treated and untreated samples, and expressed as a function of pH. The obtained curve was fitted by non-linear regression with two-pKa dependence. Results are mean ± SD (n = 3; SD < 10% are omitted for clarity).

