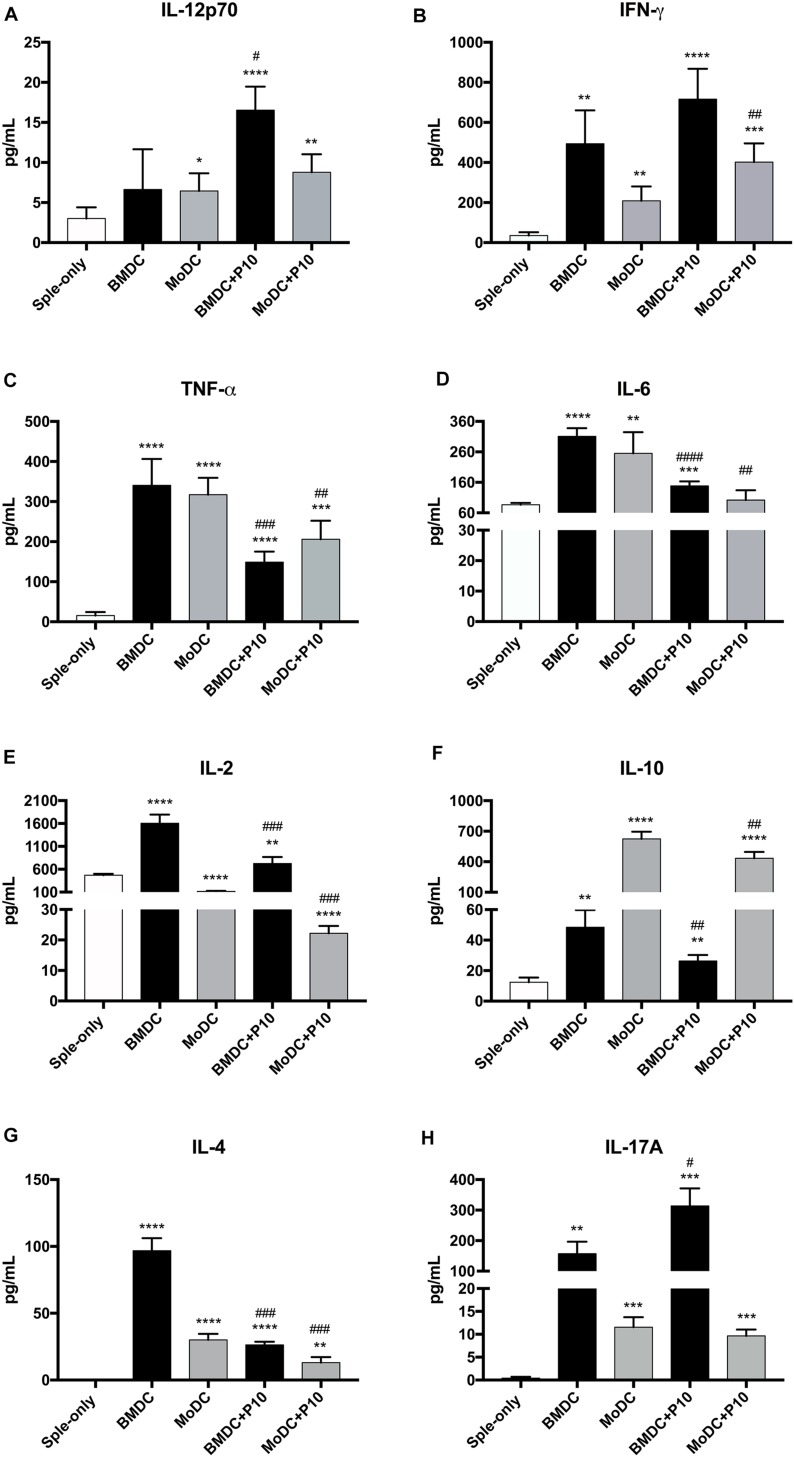
FIGURE 3.
Cytokine profile in the supernatant of co-culture of splenocytes and BMDC or MoDC pulsed or not with P10. Splenocytes from mice infected with P. brasiliensis were co-cultivated with BMDC or MoDC pulsed (BMDC+P10 or MoDC+P10) or not (BMDC or MoDC) with P10, and after 96 h the measurement of cytokines in the supernatant was analyzed by CBA. Splenocytes cultivated alone (Sple-only) were used as controls. The data are representative of two independent experiments. Data were analyzed by one-way ANOVA followed by Tukey’s post-test, where *p < 0.05, ∗∗p < 0.01, ∗∗∗p < 0.001, or ****p < 0.0001 in comparison to Sple-only (control culture with DC) and #p < 0.05, ##p < 0.01, ###p < 0.001, or ####p < 0.0001 for comparison of respective BMDC or MoDC groups pulsed or not with P10. (A–H) correspond respectively to cytokines, IL-12p70, IFN-γ, TNF-α, IL-6, IL-2, IL-10, IL-4, IL-17A.

