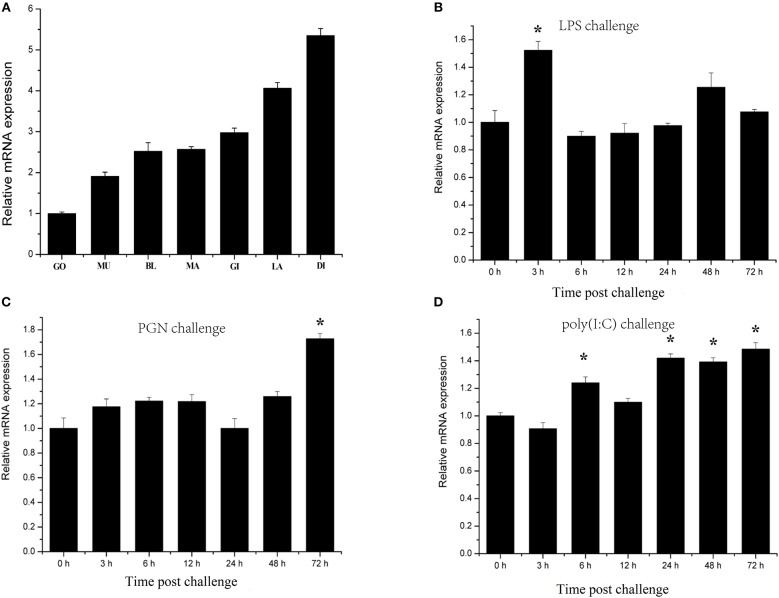
Figure 4.
Expression profiles of CgIKKα/β-2 mRNA in different tissues (A) and following challenge with different stimulants (B–D) as determined by qRT-PCR. Tissues: GO, Gonad; MU, Muscle; BL, Blood; MA, Mantle; GI, Gill; LA, Labial palp; DI, Digestive gland. β-actin gene expression was used as an internal control, and gonad was used as a reference sample. Vertical bars represent the mean ± SD (N = 3). Challenges: the different stimulants is LPS, PGN, and poly(I:C). The expression level of CgIKKα/β-2 was determined at 0, 3, 6, 12, 24, 48, and 72 h after challenge. β-actin gene expression was used as an internal control, and time 0 h was used as a reference sample. Vertical bars represent the mean ± SD (N = 3).

