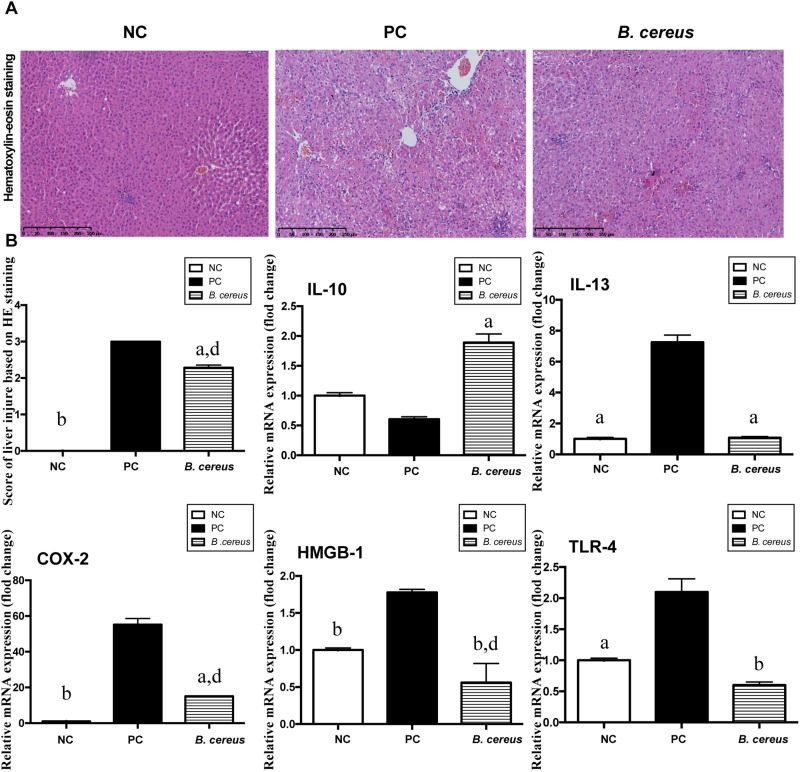
FIGURE 1.
B. cereus alleviated D-GalN-induced liver injury. (A) Representative images of hepatic H&E staining. (B) Histological scores of liver tissues based on these images: hepatic expression of the apoptosis-related cytokines COX-2 and HMGB-1 and the inflammatory cytokines IL-10, IL-13, and TLR-4. Gene expression was determined by performing quantitative PCR analysis of the total mRNA extracted from liver fragments. The results are presented as fold changes relative to the levels in the NC group. All data are presented as the mean ± SEM compared with the PC group. (NC group, n = 7; PC group, n = 6; B. cereus group, n = 7). aP < 0.05 and bP < 0.01 compared with the PC group, dP < 0.01 for the comparison of the B. cereus group with the NC group. NC, negative control; PC, positive control; H&E, hematoxylin and eosin; COX-2, cyclooxygenase-2; HMGB-1, high-mobility group box-1.

