Figure 3.
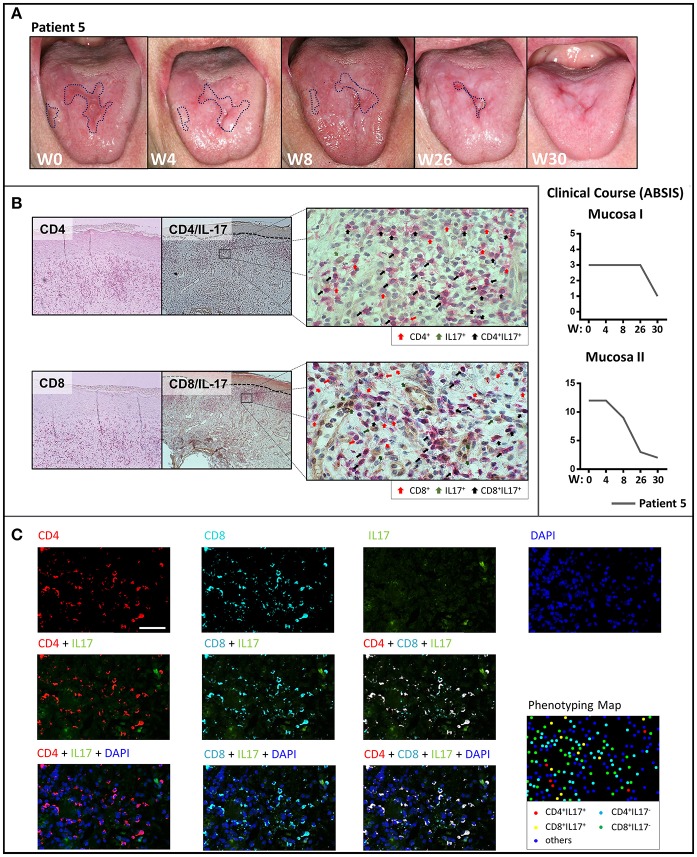
Clinical response of oral lichen planus to treatment with guselkumab and phenotypical analysis of the T cell infiltrate by immunohistochemistry and multiplex immunohistochemistry. (A) Clinical appearance of the oral mucosa with marked ulcerative lesions (dotted blue line) of patient 5 on treatment with guselkumab before treatment at week 0 (W0) and at W4, W8, W26, and W30 with the clinical course assessed by ABSIS score. There is a complete resolution of the ulcerative lesions of the tongue by W30. (B) Immunohistochemical staining for CD4, CD8, and IL-17 before treatment with guselkumab. Single staining with CD4+, CD8+ (red), and IL-17 (green) as well as double positive-staining of CD4+ or CD8+ T cells with IL-17 (black) are highlighted by arrows. (C) Multiplexed immunohistochemistry images of skin lesions showing each of the individual markers in the composite image after spectral unmixing. Markers are as below: CD4 (Opal 620, pseudocoloured red), CD8 (Opal 690, pseudocoloured cyan), IL−17 (Opal 540, pseudocoloured green), and DAPI as a nuclear marker (blue) (upper row), Multiplexed immunohistochemistry images of CD4 or/and CD8 staining merged with IL-17 (middle row). Multiplexed immunohistochemistry images of CD4 or/and CD8 along with IL-17 merged with DAPI (lower row). The cell phenotyping map identifies CD4+IL17+ cells (red dots), CD8+IL17+ cells (yellow dots), CD4+IL17− cells (cyan dots), CD8+IL17− cells (green dots), and other cells (blue dots).

