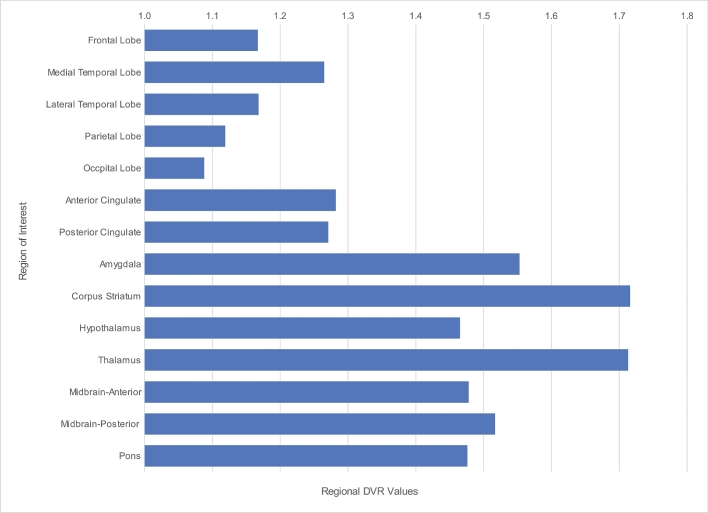
FIGURE 1.
Bar chart illustrating the differential regional [F-18]FDDNP-PET DVR values with highest values noted in parasagittal and sagittal periventricular regions of the brain including the subcortical ganglia, amygdala, and midbrain. Note also the highest brain signals in the medial temporal and frontal lobes.

