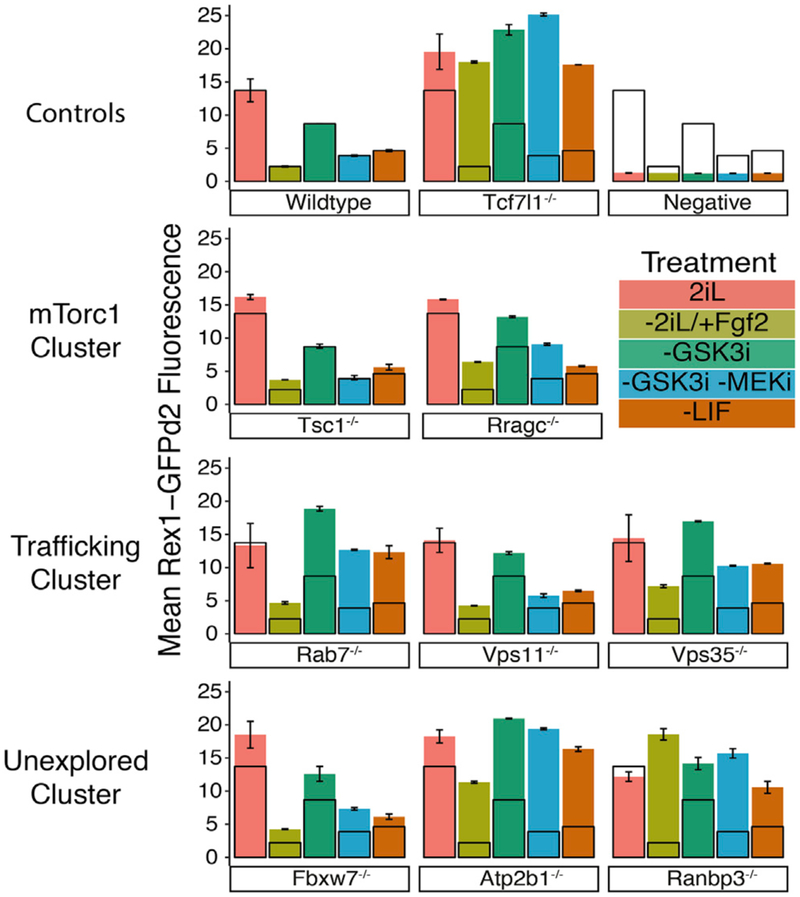
Figure 2. Delayed Loss of Rex1-GFPd2 Naive State Reporter for Mutant ESC Lines.
Flow cytometry measurement of GFP fluorescence is shown for all cells after 48 h in either 2iL, −2iL/+Fgf2, −GSK3i, −GSK3i/−MEKi, or −LIF media (treatment). The mean Rex1-GFPd2 fluorescence ± SD is shown and relates to the representative flow histograms in Figure S2. Wild-type is overlaid on all mutant and control samples as the black, unfilled bars for ease of comparison. Mutants are organized by assignment to the clusters illustrated to the left. Related to Table S5. n = 2 biological replicates of >10,000 live-cell, singlet events were acquired for each treatment of each mutant. The error bars represent SD.

