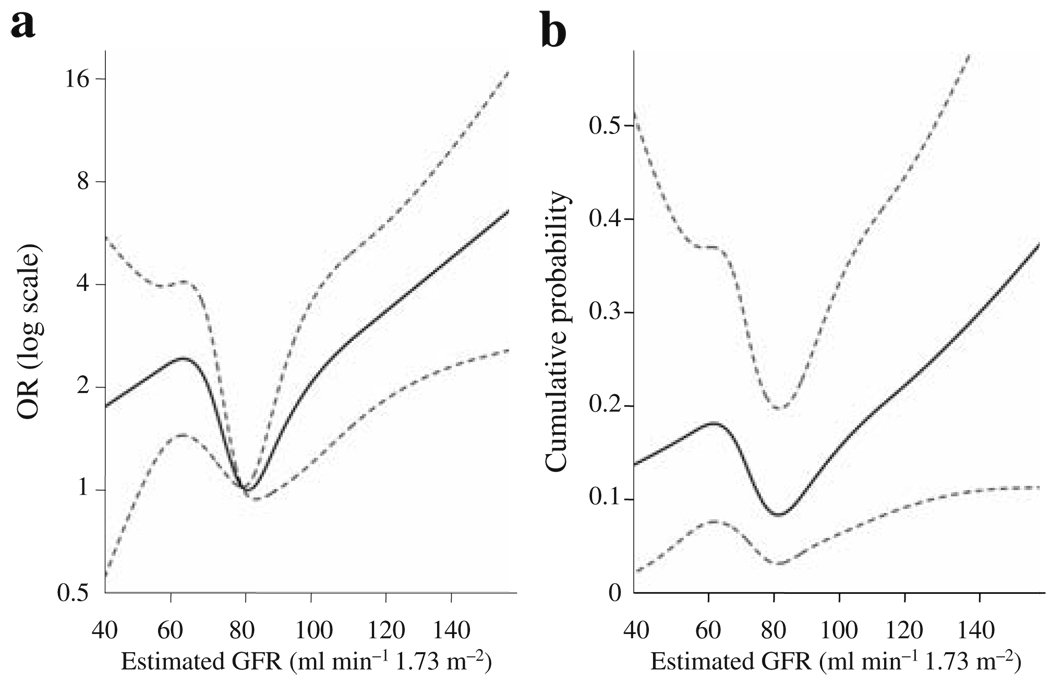
Fig. 1.
Relationship between the 5 year risk of type 2 diabetes and GFR modelled by a smooth function. a Probability of incident diabetes adjusted for age, sex, race/ethnicity, clinic location, BMI, systolic blood pressure (SBP), antihypertensive treatment, history of diabetes in first-degree relatives, insulin sensitivity index, acute insulin response and ACR, and levels of triacylglycerols, HDL-cholesterol, PAI-1 and fasting and 2 h glucose. The OR has a reference level GFR of 80 ml min−1 1.73 m−2. b The 5 year cumulative probability for a hypothetical individual with a relevant set of values for the confounders. The participant modelled is a 65 year old Hispanic man at the San Antonio clinic with the following risk factors: SBP 140 mmHg, BMI 30 kg/m2, fasting glucose 6.66 mmol/l and 2 h glucose 6.66 mmol/l. All other risk factors are at the study averages

