Fig. 2.

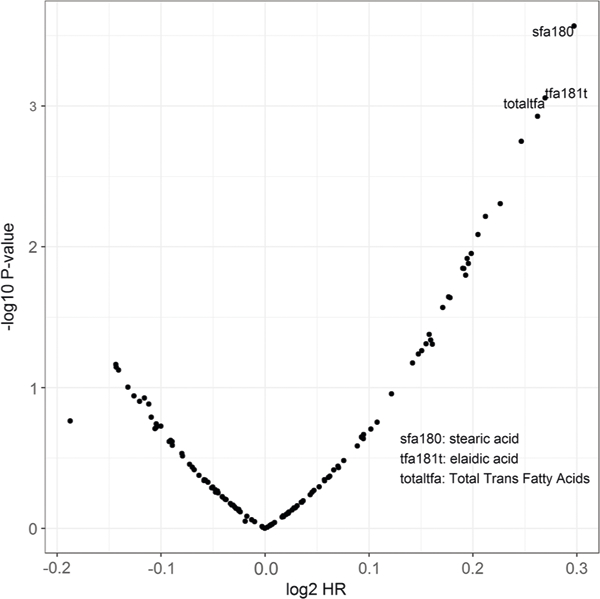
Volcano plot for scaled nutrients of the food frequency questionnaire on prostate cancer risk. The horizontal axis (log2 HR) is the log hazard ratio and the vertical axis (–log10 P-value) is the log P-value

Volcano plot for scaled nutrients of the food frequency questionnaire on prostate cancer risk. The horizontal axis (log2 HR) is the log hazard ratio and the vertical axis (–log10 P-value) is the log P-value