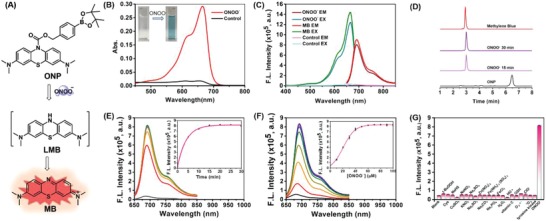
Figure 1.

Response of ONP toward ONOO−. A) The proposed response mechanism of ONP. B) The absorption spectra of ONP (10 × 10−6 m) in the absence or presence of ONOO− (100 × 10−6 m). C) The excitation and emission of ONP (10 × 10−6 m) upon addition of ONOO− (100 × 10−6 m), MB as the standard reference. D) HPLC analysis of a reaction mixture containing ONP (10 × 10−6 m) and ONOO− (100 × 10−6 m) for different incubation time in fluorescence channel (665 nm) and ONP channel (254 nm). E) Fluorescence emission spectra of ONP (10 × 10−6 m) after treatment with ONOO− (100 × 10−6 m) for different incubation time (0–30 min). Inset: Time‐dependent changes in the fluorescence intensity of ONP at 692 nm. F) Fluorescence emission spectra of ONP (10 × 10−6 m) incubated with various concentrations of ONOO− (0–100 × 10−6 m) for 15 min. Inset: Concentration‐dependent changes in the fluorescence intensity of ONP at 692 nm. G) Fluorescence intensity of ONP (10 × 10−6 m) at 692 nm in the presence of various biological species (100 × 10−6 m), except Vitamin C (2 × 10⁻³ m), glutathione (5 × 10⁻³ m), and tyrosine kinase (150 U mL−1). All data were acquired in phosphate‐buffered saline (PBS) buffer (10 × 10−3 m, pH 7.4, 5% MeCN) at 37 °C with excitation at 640 nm, the data represent the average of three independent experiments.
