Figure 3.

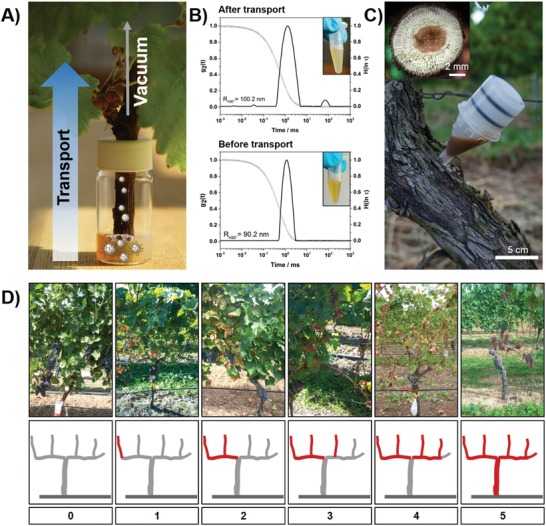
A) Shoot of a young grapevine plant through which a NC dispersion was sucked by vacuum simulating the natural transpiration pull. B) Photos and respective particle size distributions of the lignin NC dispersion before and after transport through a grapevine shoot. C) Injector filled with 5 mL of 1 wt% lignin NC dispersion and cross‐section of a grapevine plant, showing the size of the vascular bundles. D) Categorization of Esca symptoms determined in field trials graduated in six severity degrees (gray: normal growth, red: Esca symptoms observable).
