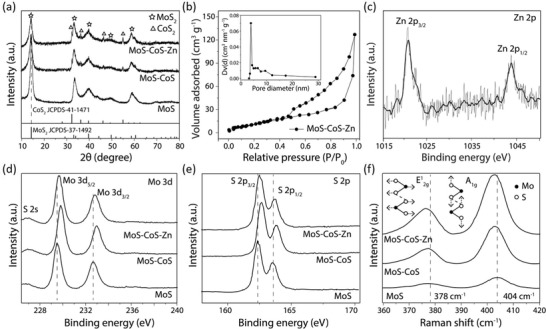
Figure 2.

Spectroscopic characterizations of MoS, MoS–CoS, and MoS–CoS–Zn. a) X‐ray diffraction patterns of MoS, MoS–CoS, and MoS–CoS–Zn. Dotted line shows the first XRD peak position of MoS. b) N2 adsorption–desorption isotherm of MoS–CoS–Zn. Inset: the corresponding pore size distribution. c) High‐resolution Zn 2p spectrum of MoS–CoS–Zn. High‐resolution d) Mo 3d and e) S 2p XPS spectra of MoS, MoS–CoS, and MoS–CoS–Zn. Dotted lines in (d) and (e) show the original XPS peak positions of MoS. f) Raman spectra of MoS, MoS–CoS, and MoS–CoS–Zn. Schematic illustration presents the atomic displacements in E1 2g and A1g vibrational modes, and the dotted lines indicate the corresponding peak positions of MoS.
