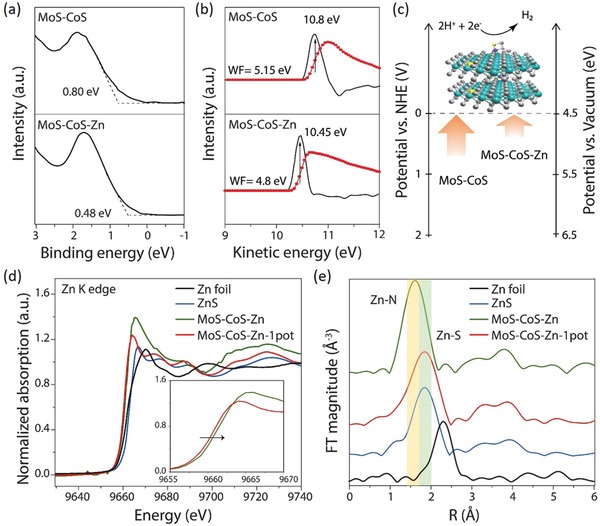
Figure 4.

Structural and electronic properties of the MoS–CoS–Zn. a) Low binding energy edge of UPS showing the valence band maxima of MoS–CoS and MoS–CoS–Zn with respect to Fermi level. b) UPS investigations for work function. The red and black dotted lines present the data measured by the instrument and the differentiate curve, from which kinetic energy at the secondary electron edge is obtained at the peak position. Details of the calculations can be found in the Supporting Information. c) Schematic representing the energy level orientations of MoS–CoS and MoS–CoS–Zn with respect to the water dissociation potential. d) Normalized Zn K‐edge XANES spectra of MoS–CoS–Zn, MoS–CoS–Zn‐1pot, ZnS, and Zn foil. Inset: the absorption edge between 9655 and 9670 eV. e) Zn K‐edge k2‐weighted EXAFS spectra of MoS–CoS–Zn, MoS–CoS–Zn‐1pot, ZnS, and Zn foil. The highlighted regions show Zn–N and Zn–S coordination peak ranges.
