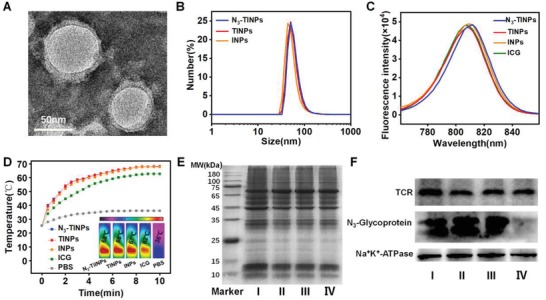
Figure 2.

Characterization of dual‐targeting N3‐TINPs. A) TEM image of N3‐TINPs. B) Size distribution of N3‐TINPs, TINPs, and INPs. C) Fluorescence spectra of different nanoparticles and free ICG. D) Infrared thermal images and temperature curve. E) SDS‐PAGE protein analysis. F) Western blotting analysis of TCR and N3‐glycoprotein. I: T cell lysate, II: T cell membrane vesicle, III: N3‐TINPs, IV: TINPs.
