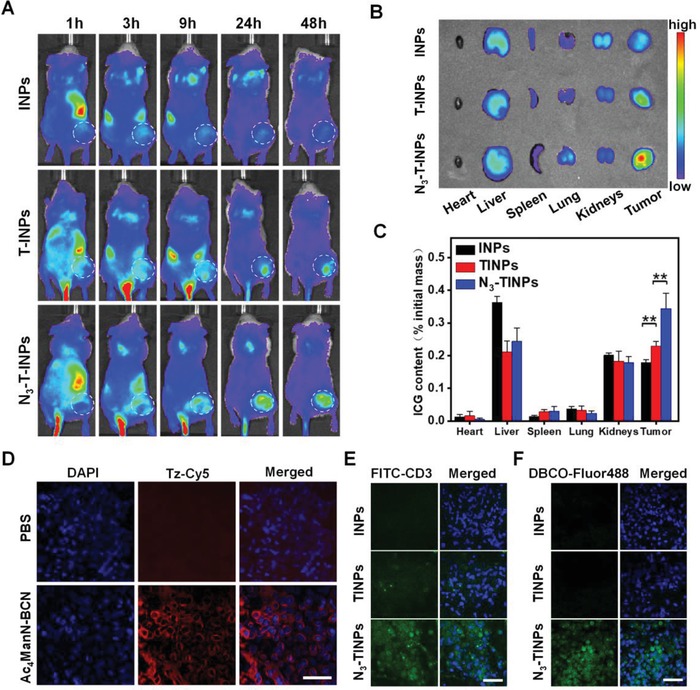
Figure 4.

In vivo targeting and biodistribution of dual‐targeting N3‐TINPs. A) In vivo imaging analysis of mice after administered with different nanoparticles. B) The major organs and tumors of mice with the indicated treatment were harvested for ex vivo imaging at 48 h postinjection. C) The ICG content of each organ was quantified by fluorescence. D) The generation of BCN groups on tumor tissues were recorded by confocal microscopy. E,F) Evaluating the enrichment of N3‐TINPs in tumor tissues. The tumor tissue sections of mice administered different treatments were stained with anti‐CD3‐FITC and DBCO‐Flour 488. Scale bar: 50 µm. Statistical P‐values: (**) P < 0.01.
