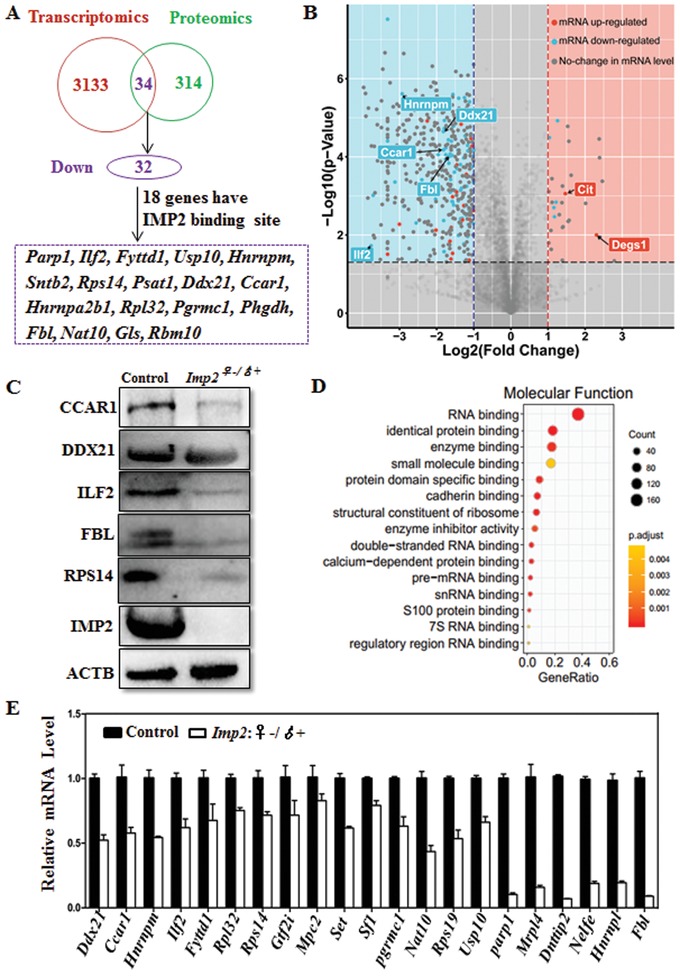
Figure 4.

Deletion of Imp2 results in extensive downregulation of transcription during zygotic genome activation. A) Schematic diagram showing the late 2‐cell‐stage, control embryos and Imp2‐knockout embryos (Imp2♀−/♂+) for RNA sequencing (20 embryos per group, 3 replicates) and proteomic analyses (330 embryos per group, 3 replicates). B) Volcano plot showing the downregulated and upregulated genes in 2‐cell‐stage Imp2‐knockout embryos in fold change (x‐axis) and statistical significance (−log10 of the p value, y‐axis). Different dots indicate the transcription change, while the background color represents the protein change. The red dots indicate upregulated genes, the blue dots indicate downregulated genes, and the gray dots indicate no change in transcription. Cit and Degs1 are upstream genes of Imp2. C) Western blot of 2‐cell‐stage embryos from control and Imp2−/− female mice probed with antibodies against CCAR1, DDX21, ILF2, FBL, RPS14, IMP2, and ACTB. D) Gene ontology analysis of the downregulated genes in Imp2 ♀ − /♂+ embryos compared with control embryos at the 2‐cell‐stage. E) Quantitative real‐time PCR (qRT‐PCR) analysis showing the expression of transcripts in control and Imp2 ♀ − /♂+ embryos at the 2‐cell‐stage. Error bars indicate the SEM.
