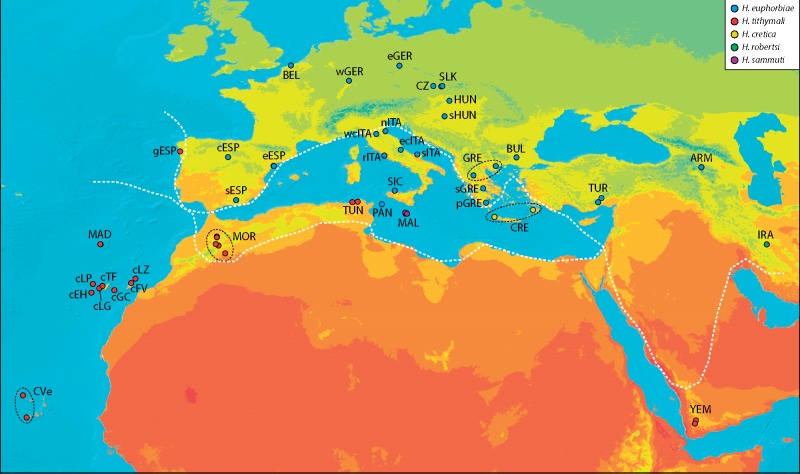
Fig. 1.
—Geographical distribution of the HEC. Geographical sampling of HEC populations mapped onto an annual mean temperature map using ArcGIS Desktop v.10.3. Temperature data were derived from WorldClim and mapped at 1-km2 spatial resolution with a temporal range of ∼1950–2010. Colors of circles ascribe sample sites to the five species of the currently valid taxonomy. Dashed white lines separate the two morphological species groups based on Hyles euphorbiae (north) and Hyles tithymali (south) and enclose the areas with larvae of intermediate morphology (including Hyles cretica and Hyles sammuti).

