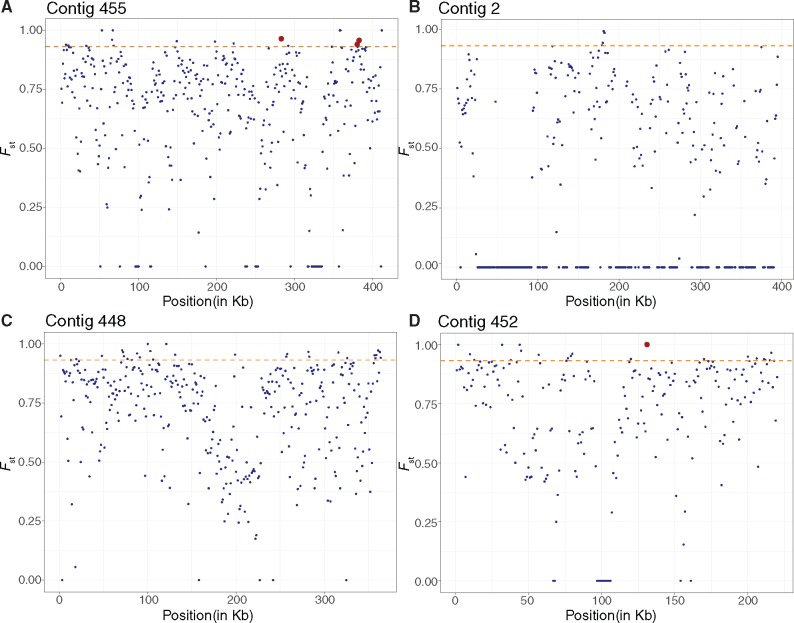
Fig. 3.
—Population structure analyses in 1-kb windows and 1-kb steps between Lactobacillus micheneri and Lactobacillus timberlakei mapped to four Lactobacillus micheneri Hlig3 contigs reveal strong population structure. The orange dashed line represents the threshold for the 1-kb windows with the 95th percentile Fst (0.932). Red dots represent gene regions discussed in text, listed from left to right as: LtaS, cshA, MurR, and kup. Regions where Fst above the 95th percentile is listed in supplementary table 4, Supplementary Material online.

