
Figure 5.
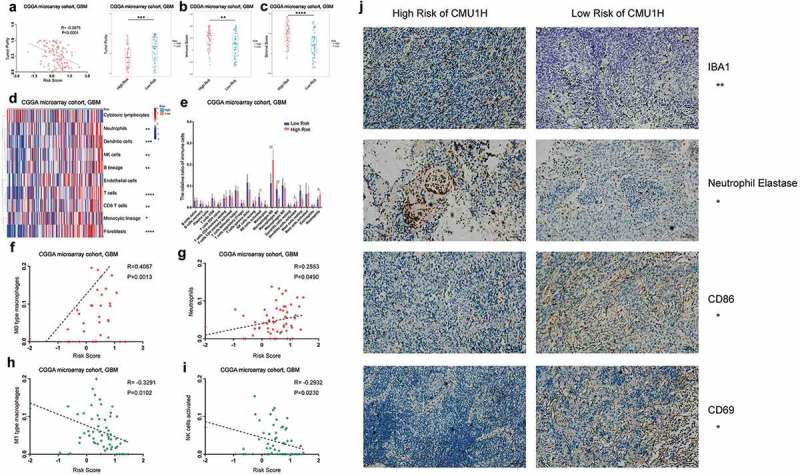
The relationship between the interferon signature with the glioma microenvironment. A, There was a significantly negative correlation between the tumor purity and the risk score. The high-risk group occupied a higher immune score and stromal score (B and C). MCP analysis showed there was an extreme enrichment of immune and stromal cell in the high-risk group (D). CIBERSORT results showed that the high-risk group was associated with more macrophages and neutrophils; while activated NK cells and M1 type macrophages were enriched in low-risk group (E). Positive correlations exist between risk score and M0 macrophages as well as neutrophils (F and G), while the risk score showed a negative correlation with M1 macrophages and activated NK cells (H and I). J, IHC staining confirmed the CIBERSORT analysis results. (A-I were performed in CGGA microarray cohort; J was conducted in the First Hospital of China Medical University; * means P < 0.05, ** means P < 0.01, *** means P < 0.001, **** means P < 0.0001).