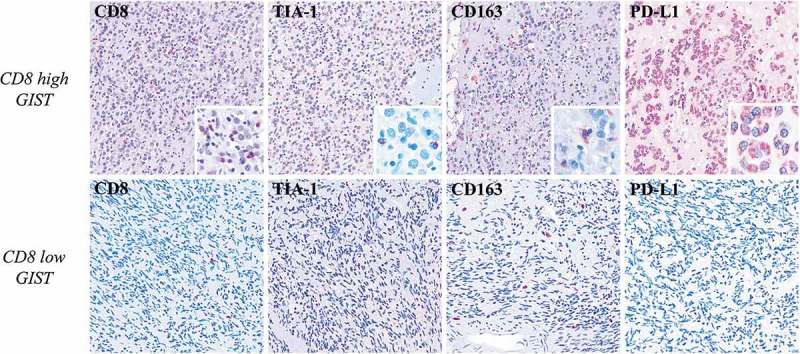
Figure 3.

Immunohistochemical characterization of GIST samples. In the upper row, one high-CD8+ GIST shows high number of Tia-1+ (x100) (inset: x400) cell of microenvironment, presence of M2 CD163+ macrophages (x100) (inset: x400), and PD-L1 positivity (x100) (inset: x400) in the neoplastic population. The lower row shows one low-CD8+ sample that is characterized instead by a very low number Tia-1+ (x100) cells, presence of M2 CD163+ macrophages (x100), and PD-L1 negativity (x100) in the neoplastic population. The comparison between the two GIST groups high-CD8+ versus low-CD8+ highlights significant differences in the CD8 and TIA1 proteins expression (p = 0.01 and p = 0.02 respectively); differently, there are no significant differences in terms of CD163 and PD-L1 (p = 0.37 and p = 0.71 respectively).
