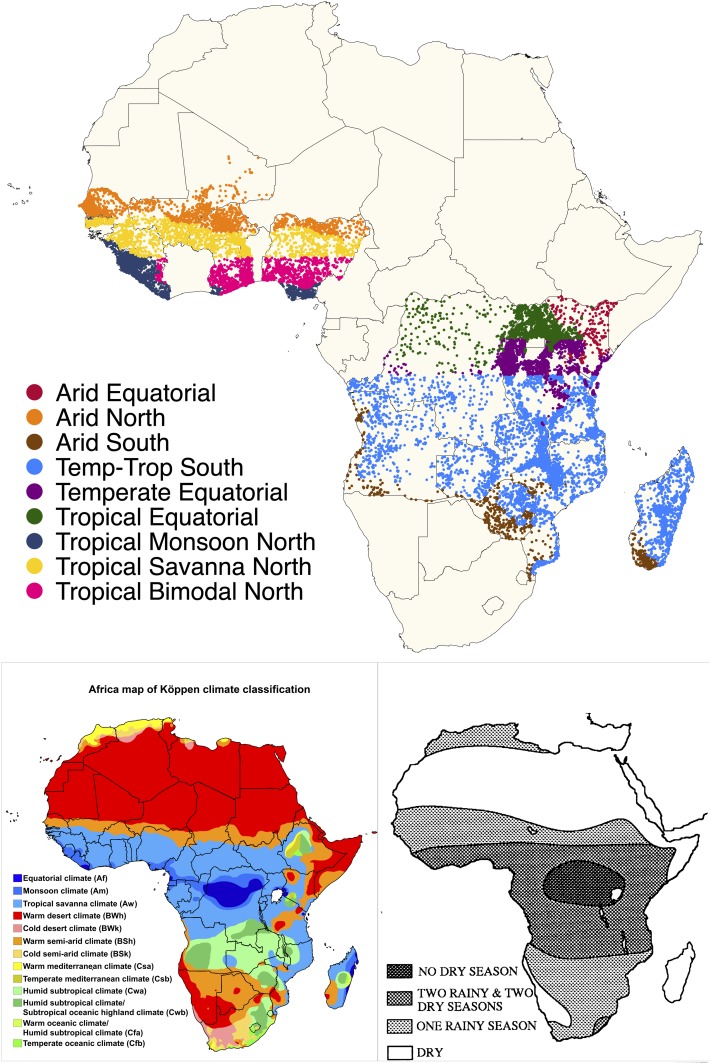
Figure 1.
Top: map of included Demographic and Health Surveys and Malaria Indicator Survey clusters (dots) by rainfall typology (colors). Bottom left: Koppen climate classifications for Africa. Bottom right: map of unimodal and bimodal rainfall in Africa, map reproduced from ref. 29, Figure 3. This figure appears in color at www.ajtmh.org.

