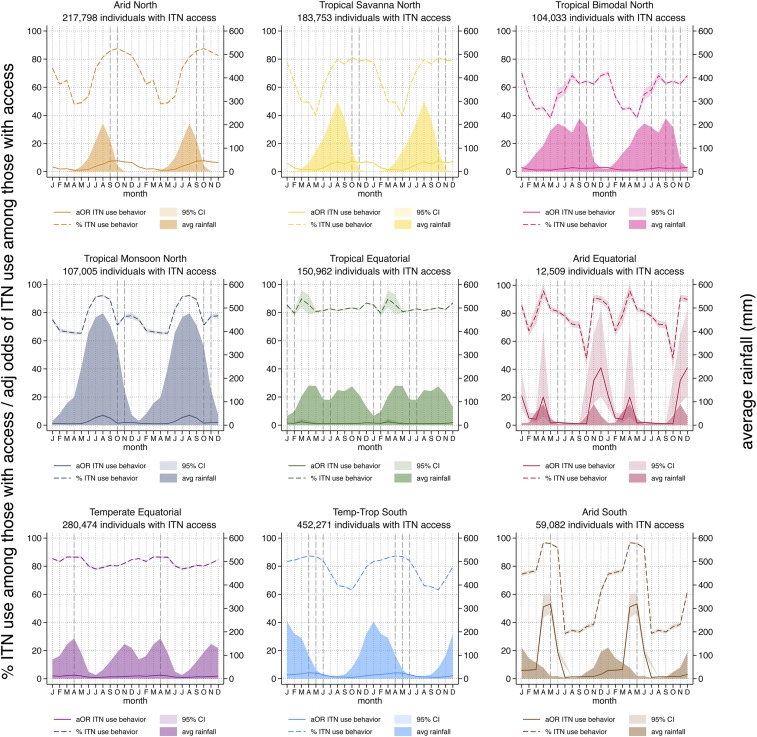
Figure 2.
Percent of individuals using an insecticide-treated net (ITN) the previous night among those with access (dotted lines); average rainfall (shaded areas); and adjusted odds of ITN use among those with access (solid lines). Vertical dashed lines indicate the month of peak malaria incidence from selected sites within each zone. To better visualize the relationships between the seasonal patterns, particularly for zones in the southern hemisphere where peak rainfall occurs in December–January, the same 12 months of data are plotted twice in succession. This figure appears in color at www.ajtmh.org.

