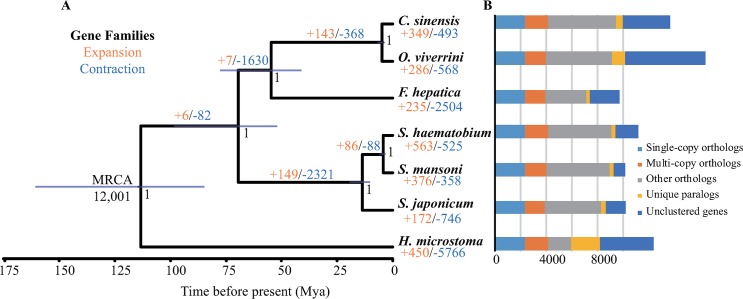
Fig 3. Comparative genome analysis between S. japonicum and other six flatworms.
(A) Phylogenetic tree and expansion and contraction of gene families. The phylogenetic tree and divergence time were generated from 2,322 single-copy orthologous genes using BEAST2. The branch lengths of the phylogenetic tree are scaled to estimated divergence time. Tree topology is supported by posterior probability of 1.0 for all nodes. The blue bars on the nodes indicate the 95% credibility intervals of the estimated posterior distributions of the divergence times. The number of expanded (orange) and contracted (blue) gene families is designated on each branch. Bar charts indicates the orthologous and paralogous gene families in S. japonicum and other six flatworm species. (B) Comparison of the number of gene families in 7 Platyhelminthes species.

