
Fig 3. Validation of RNAseq data by qRT-PCR for 5 selected genes.
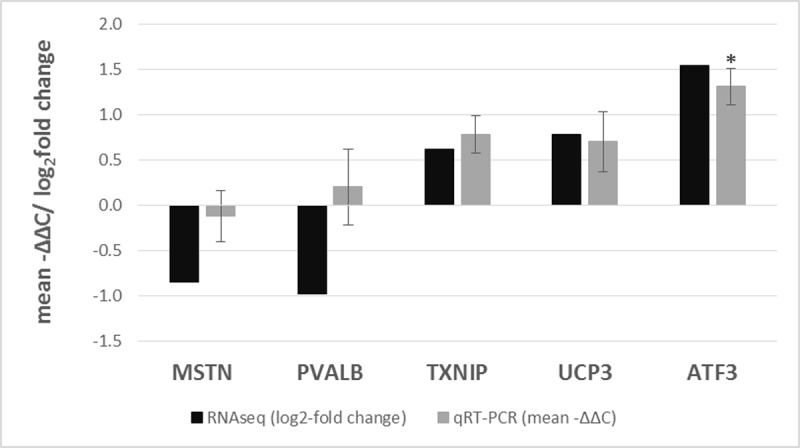
RNAseq data is shown as log2-fold change, while qPCR data is shown as mean –ΔΔCt ± SD, so that they are comparable, (n = 6). All RNAseq results are significant; significant difference detected by qRT-PCR is marked with *. The significance level was set to p<0.05. The expression of selected genes was normalized to GAPDH- glyceraldehyde-3-phosphate dehydrogenase and ACTB- β-actin in the qRT-PCR analysis. TXNIP- thioredoxin-interacting protein; UCP3- uncoupling protein 3 (mitochondrial, proton carrier); ATF3- Activating transcription factor 3; PVALB- parvalbumin; MSTN- myostatin.