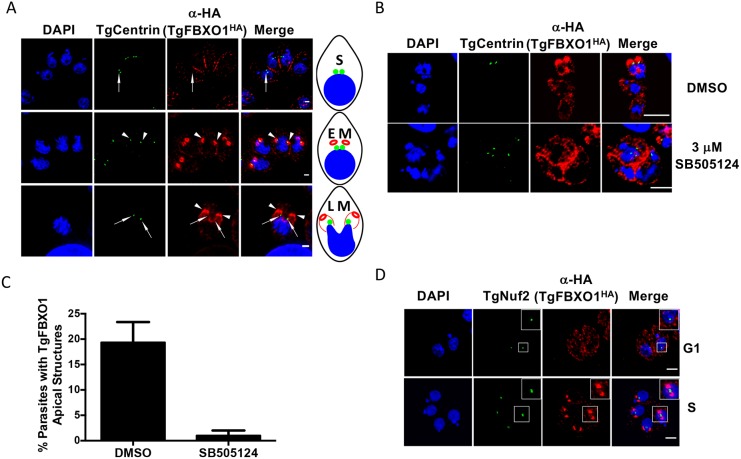
Fig 4. TgFBXO1 apical structures form after centrosome duplication and are localized apically to the parasite centrosome.
(A). TgFBXO1HA-expressing parasites were fixed and stained to detect TgCentrin1, TgFBXO1, and DNA during S, early M (EM), and late M (LM) phases. Arrowheads highlight TgFBXO1 apical structures and arrows highlight TgCentrin1. Bars = 2μm. A schematic depicting the cell cycle phases is shown. (B). Parasites were treated with 3 μM SB505124 (or DMSO as a vehicle control) for 24 h, fixed and then stained to detect TgCentrin1, TgFBXO1, and DNA. Note the appearance of SB505124-treated parasites with >2 centrin1+ foci and disorganized TgFBXO1 staining. Bars = 5 μm. (C). Quantification of numbers of parasites with apical TgFBXO1 structures. Data represents averages and standard deviations of three independent experiments with at least 50 parasites examined/experiment (D). TgFBXO1HA parasites were stained to detect TgFBXO1 and the kinetochore marker TgNuf2. Note TgFBXO1HA apical structures form after kinetochore duplication but before separation is completed as evidenced by the lobed TgNuf2 staining (Insert). Bars: 2μm.

